

1. The Macro Context (The "Why") 🌍
Hi traders! Before looking at the candles, let's look at the money. My fundamental scoring table speaks clearly: there is a huge differential that we cannot ignore.
Key Factor Analysis:
🏦 Rate Expectations: Explanation: The RBA maintains a neutral stance with a prolonged holding trend at 3.6%, while the BOC is in a pause phase following an October cut, maintaining a dovish stance with potential for further cuts. Score AUD: 0 Score CAD: -1
🎈 Inflation: Explanation: Australian inflation is at 3.4%, above target but manageable, allowing the RBA to maintain its current stance. Canadian inflation is well-controlled at 2.22%, very close to the 2% target. Score AUD: +1 Score CAD: 0
📈 Growth/GDP: Explanation: Australia shows robust resilience with 2.3% growth despite high inflation. Canada's growth is more modest but sustainable at 1.6%. Score AUD: +1 Score CAD: 0
🏭 PMI Data: Explanation: AUD PMI is showing strong expansion at 54.2 (weighted). CAD Ivey PMI is at 51.9, indicating expansion and a strong recovery of +3.5 points. Score AUD: +1 Score CAD: +1
⚖️ Risk Sentiment: Explanation: Both currencies are currently in a neutral regime with no clear directional bias from risk sentiment. Score AUD: 0 Score CAD: 0
🗞️ News Catalyst: Explanation: No significant secondary data surprises for AUD recently, while CAD faces a weaker labour market with a high unemployment rate of 5.4%. Score AUD: 0 Score CAD: -1
Currency Score Summary:
Total Score AUD: +4 (Strong) Total Score CAD: -1 (Weak)
Synthesis:
AUD (Strong, Score +4): Resilient economy with solid growth and competitive rates for carry trade. CAD (Weak, Score -1): Mixed performance with a dovish BOC stance and a softening labour market weighing on the currency. Conclusion: With this scenario, we are only looking for Long positions. Going against this bias would be statistical suicide.
2. The Technical Setup (The "Where") 📉
Timeframe: 4H | Pair: AUD/CAD
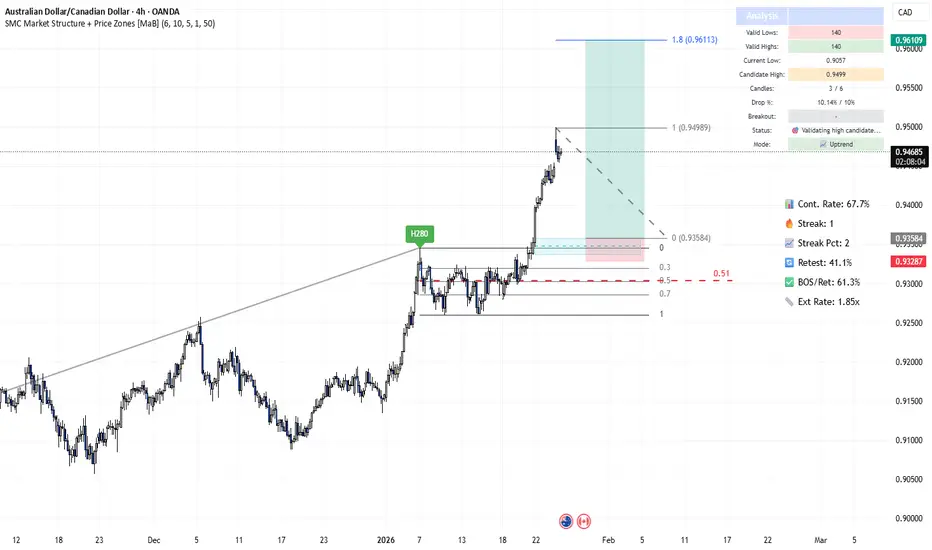
The SMC Market Structure + Price Zones [MaB] indicator gave us the confirmation we needed for our statistical edge. Here is where the indicator makes the difference. Look at the dashboard on the right, numbers don't lie:
🚀 Continuation Rate (67.7%): We are well above the 60% threshold. This tells us the market is in a healthy, directional trend. Statistically, betting on continuation pays off more than looking for a reversal.
🔥 Streak (1) & Streak Pct (2): We are at the early stages of a new impulse. It's a fresh trend move, giving us room to breathe and capture the expansion.
🔄 Retest (41.1%): The indicator tells us that statistically, when price creates a new Break of Structure (BOS), it retraces into the previous zone only 41.1% of the time. Therefore, it pays to be precise with entry placement in the identified demand zones.
💥 BOS/Ret Rate (61.3%): This parameter tells us that once price retraces inside the previous zone, it has a 61.3% probability of reacting and creating a new BOS.
🎯 Extension Rate (1.85x): The algorithm projects an ambitious target. We expect this move to extend 1.85 times the current pullback leg. That's where we'll take profit.
3. Execution Plan on Chart
Moving to the chart, the SMC Market Structure + Price Zones [MaB] indicator supports us in pinpointing liquidity to define entry and stop loss:
Entry and Stop Loss: We place a limit entry in the Demand Zone 4H (Cyan Band) at 0.93584 and the stop loss a few pips below the zone at 0.93287.
Take Profit: We leverage the asset's statistical analysis offered by the Extension Rate and place the target by measuring with Fibonacci at 1.8x (conservative) to 1.85x relative to the pullback leg.
Trade Parameters:
Entry Price: 0.93584 Stop Loss: 0.93287 Take Profit: 0.96109
⚠️ Disclaimer: This analysis is based on a proprietary algorithm and is shared exclusively for educational and didactic purposes. It does not constitute financial advice or investment solicitation in any way. Trading involves significant risk.
Hi traders! Before looking at the candles, let's look at the money. My fundamental scoring table speaks clearly: there is a huge differential that we cannot ignore.
Key Factor Analysis:
🏦 Rate Expectations: Explanation: The RBA maintains a neutral stance with a prolonged holding trend at 3.6%, while the BOC is in a pause phase following an October cut, maintaining a dovish stance with potential for further cuts. Score AUD: 0 Score CAD: -1
🎈 Inflation: Explanation: Australian inflation is at 3.4%, above target but manageable, allowing the RBA to maintain its current stance. Canadian inflation is well-controlled at 2.22%, very close to the 2% target. Score AUD: +1 Score CAD: 0
📈 Growth/GDP: Explanation: Australia shows robust resilience with 2.3% growth despite high inflation. Canada's growth is more modest but sustainable at 1.6%. Score AUD: +1 Score CAD: 0
🏭 PMI Data: Explanation: AUD PMI is showing strong expansion at 54.2 (weighted). CAD Ivey PMI is at 51.9, indicating expansion and a strong recovery of +3.5 points. Score AUD: +1 Score CAD: +1
⚖️ Risk Sentiment: Explanation: Both currencies are currently in a neutral regime with no clear directional bias from risk sentiment. Score AUD: 0 Score CAD: 0
🗞️ News Catalyst: Explanation: No significant secondary data surprises for AUD recently, while CAD faces a weaker labour market with a high unemployment rate of 5.4%. Score AUD: 0 Score CAD: -1
Currency Score Summary:
Total Score AUD: +4 (Strong) Total Score CAD: -1 (Weak)
Synthesis:
AUD (Strong, Score +4): Resilient economy with solid growth and competitive rates for carry trade. CAD (Weak, Score -1): Mixed performance with a dovish BOC stance and a softening labour market weighing on the currency. Conclusion: With this scenario, we are only looking for Long positions. Going against this bias would be statistical suicide.
2. The Technical Setup (The "Where") 📉
Timeframe: 4H | Pair: AUD/CAD
The SMC Market Structure + Price Zones [MaB] indicator gave us the confirmation we needed for our statistical edge. Here is where the indicator makes the difference. Look at the dashboard on the right, numbers don't lie:
🚀 Continuation Rate (67.7%): We are well above the 60% threshold. This tells us the market is in a healthy, directional trend. Statistically, betting on continuation pays off more than looking for a reversal.
🔥 Streak (1) & Streak Pct (2): We are at the early stages of a new impulse. It's a fresh trend move, giving us room to breathe and capture the expansion.
🔄 Retest (41.1%): The indicator tells us that statistically, when price creates a new Break of Structure (BOS), it retraces into the previous zone only 41.1% of the time. Therefore, it pays to be precise with entry placement in the identified demand zones.
💥 BOS/Ret Rate (61.3%): This parameter tells us that once price retraces inside the previous zone, it has a 61.3% probability of reacting and creating a new BOS.
🎯 Extension Rate (1.85x): The algorithm projects an ambitious target. We expect this move to extend 1.85 times the current pullback leg. That's where we'll take profit.
3. Execution Plan on Chart
Moving to the chart, the SMC Market Structure + Price Zones [MaB] indicator supports us in pinpointing liquidity to define entry and stop loss:
Entry and Stop Loss: We place a limit entry in the Demand Zone 4H (Cyan Band) at 0.93584 and the stop loss a few pips below the zone at 0.93287.
Take Profit: We leverage the asset's statistical analysis offered by the Extension Rate and place the target by measuring with Fibonacci at 1.8x (conservative) to 1.85x relative to the pullback leg.
Trade Parameters:
Entry Price: 0.93584 Stop Loss: 0.93287 Take Profit: 0.96109
⚠️ Disclaimer: This analysis is based on a proprietary algorithm and is shared exclusively for educational and didactic purposes. It does not constitute financial advice or investment solicitation in any way. Trading involves significant risk.

Trading indicators development focused on Smart Money Concepts (SMC), market structure analysis, and liquidity zones.
WEBSITE: mab-arreca.com/
WHOP: whop.com/mab-9cb1/
YOUTUBE: youtube.com/@MaB.arreca
WEBSITE: mab-arreca.com/
WHOP: whop.com/mab-9cb1/
YOUTUBE: youtube.com/@MaB.arreca
Похожие публикации
Отказ от ответственности
Информация и публикации не предназначены для предоставления и не являются финансовыми, инвестиционными, торговыми или другими видами советов или рекомендаций, предоставленных или одобренных TradingView. Подробнее читайте в Условиях использования.
Trading indicators development focused on Smart Money Concepts (SMC), market structure analysis, and liquidity zones.
WEBSITE: mab-arreca.com/
WHOP: whop.com/mab-9cb1/
YOUTUBE: youtube.com/@MaB.arreca
WEBSITE: mab-arreca.com/
WHOP: whop.com/mab-9cb1/
YOUTUBE: youtube.com/@MaB.arreca
Похожие публикации
Отказ от ответственности
Информация и публикации не предназначены для предоставления и не являются финансовыми, инвестиционными, торговыми или другими видами советов или рекомендаций, предоставленных или одобренных TradingView. Подробнее читайте в Условиях использования.