
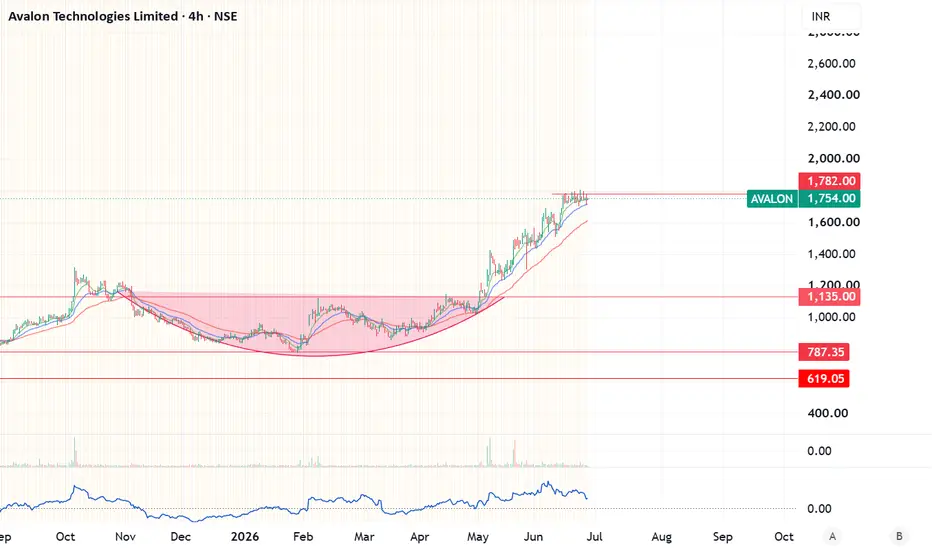
Avalon Technologies continues to exhibit a strong Stage-2 uptrend, supported by a well-defined rounding base breakout and sustained buying momentum. The stock has delivered an impressive rally from the ₹800–1,100 accumulation zone and is now consolidating just below its all-time high area.
The current price action indicates healthy consolidation after a sharp up move rather than weakness, suggesting that buyers are absorbing supply near the resistance zone.
Current Price
₹1,754
Trend Structure
✅ Strong long-term uptrend
✅ Trading above 20 EMA, 50 EMA and 200 EMA
✅ Higher Highs & Higher Lows intact
✅ Strong relative strength versus the broader market
✅ Healthy consolidation after a vertical rally
✅ No signs of distribution yet
The stock appears to be preparing for its next directional move.
Pattern Analysis
The chart shows:
Large Rounding Bottom Formation
Stage-2 Trend Continuation
Bullish Flag / Rectangle consolidation near highs
Institutional accumulation visible after breakout above ₹1,135.
Unlike weak breakouts that quickly reverse, Avalon has held above its breakout level for several months, indicating strong conviction from market participants.
Key Technical Levels
Immediate Support
₹1,700
₹1,630
₹1,550
Major Resistance
₹1,800–1,820 (Current breakout zone)
A decisive close above this zone could trigger the next leg of the rally.
Positional Trade Setup
Aggressive Entry
₹1,720–1,760
Accumulate on minor pullbacks while the stock remains above ₹1,700.
Conservative Entry
Wait for a daily/weekly close above ₹1,820 with above-average volumes.
This would confirm a fresh breakout and reduce the probability of a false move.
Targets
Target Price
Target 1 ₹1,950
Target 2 ₹2,150
Target 3 ₹2,400
Long-Term Target ₹2,700+
Stop Loss
₹1,620 (Closing Basis)
For short-term swing traders, a tighter stop below ₹1,680 can also be considered depending on risk appetite.
Risk-Reward
Potential Upside: 25–40%
Downside Risk: 7–9%
Risk-Reward: Approximately 1:3
This is an attractive setup provided the breakout is confirmed.
The current price action indicates healthy consolidation after a sharp up move rather than weakness, suggesting that buyers are absorbing supply near the resistance zone.
Current Price
₹1,754
Trend Structure
✅ Strong long-term uptrend
✅ Trading above 20 EMA, 50 EMA and 200 EMA
✅ Higher Highs & Higher Lows intact
✅ Strong relative strength versus the broader market
✅ Healthy consolidation after a vertical rally
✅ No signs of distribution yet
The stock appears to be preparing for its next directional move.
Pattern Analysis
The chart shows:
Large Rounding Bottom Formation
Stage-2 Trend Continuation
Bullish Flag / Rectangle consolidation near highs
Institutional accumulation visible after breakout above ₹1,135.
Unlike weak breakouts that quickly reverse, Avalon has held above its breakout level for several months, indicating strong conviction from market participants.
Key Technical Levels
Immediate Support
₹1,700
₹1,630
₹1,550
Major Resistance
₹1,800–1,820 (Current breakout zone)
A decisive close above this zone could trigger the next leg of the rally.
Positional Trade Setup
Aggressive Entry
₹1,720–1,760
Accumulate on minor pullbacks while the stock remains above ₹1,700.
Conservative Entry
Wait for a daily/weekly close above ₹1,820 with above-average volumes.
This would confirm a fresh breakout and reduce the probability of a false move.
Targets
Target Price
Target 1 ₹1,950
Target 2 ₹2,150
Target 3 ₹2,400
Long-Term Target ₹2,700+
Stop Loss
₹1,620 (Closing Basis)
For short-term swing traders, a tighter stop below ₹1,680 can also be considered depending on risk appetite.
Risk-Reward
Potential Upside: 25–40%
Downside Risk: 7–9%
Risk-Reward: Approximately 1:3
This is an attractive setup provided the breakout is confirmed.

Отказ от ответственности
Информация и публикации не предназначены для предоставления и не являются финансовыми, инвестиционными, торговыми или другими видами советов или рекомендаций, предоставленных или одобренных TradingView. Подробнее читайте в Условиях использования.
Отказ от ответственности
Информация и публикации не предназначены для предоставления и не являются финансовыми, инвестиционными, торговыми или другими видами советов или рекомендаций, предоставленных или одобренных TradingView. Подробнее читайте в Условиях использования.