
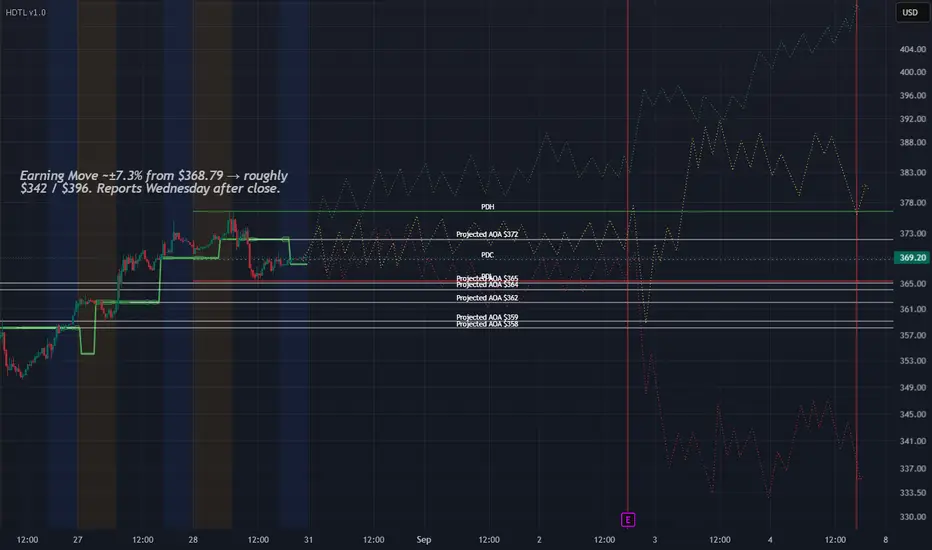
AVGO reports Wednesday after the close, and this is one of the more interesting charts I’m watching because I don’t think the only opportunity is the initial earnings reaction.
The options market is pricing roughly a ±7.3% move, which puts the implied range around $342–396 from the current area.
That gives us a useful framework, but the real trade will come from how price behaves after the first move.
Green Scenario — Multi-Day Runner
The bullish path starts with AVGO reclaiming and holding the 372–378 area.
If earnings are strong and price can establish acceptance above that structure, I would not assume the entire move has to happen in one night.
What I’d prefer to see is something similar to what CRM gave us:
earnings impulse → controlled pullback → support forms → continuation
That kind of structure can produce a much cleaner second-day or even multi-day trade than trying to catch the first after-hours candle.
Above the current structure, the 396 implied-move area becomes the obvious first major destination.
If AVGO gets through that area and continues building support rather than immediately rejecting, then 400+ becomes a legitimate expansion scenario.
That would be the fast version.
Yellow Scenario — Slower Recovery
Yellow may actually be the scenario I like almost as much as Green.
AVGO does not need to explode immediately for the setup to remain constructive.
It could spend time negotiating between roughly 365–378, absorb the earnings reaction, and gradually rebuild structure.
That slower path could look like:
hold lower support → reclaim 372 → test PDH / 378 → consolidate → continue
Sometimes that is the better trade.
A slower recovery gives us time to identify where buyers are actually defending price instead of reacting to a single earnings candle.
If AVGO remains above the lower structure and continues producing higher lows, I would keep the larger bullish thesis alive even if it takes several sessions to reach the upper implied-move area.
Red Scenario — Still on the Table
Red absolutely remains possible, but right now I grade it below Green and Yellow.
The first warning would be a loss of 365 / PDL.
Below there, AVGO has a cluster of Projected Areas of Agreement around:
362 → 359 → 358
That cluster matters.
If earnings produce a violent flush through those levels, I would not automatically treat that as a reason to chase puts.
That could actually create the other setup we’ve been studying:
overreaction → reclaim → reversal
If the entire 358–362 structure fails and price begins accepting beneath it, then the lower implied-move area around 342 becomes much more realistic.
What I’m Really Watching
I’m not trying to predict whether Broadcom beats earnings.
I’m trying to determine which post-earnings sequence develops.
Green: breakout, hold, continuation — potentially a multi-day runner like CRM.
Yellow: slower recovery, structure builds, continuation develops over several sessions.
Red: breakdown through support, with the possibility of either continued deterioration or an overreaction reclaim.
Right now I favor:
Green / Yellow > Red
But that weighting changes the second the market gives us different evidence.
The earnings number is information.
The reaction + structure is the trade.
The options market is pricing roughly a ±7.3% move, which puts the implied range around $342–396 from the current area.
That gives us a useful framework, but the real trade will come from how price behaves after the first move.
Green Scenario — Multi-Day Runner
The bullish path starts with AVGO reclaiming and holding the 372–378 area.
If earnings are strong and price can establish acceptance above that structure, I would not assume the entire move has to happen in one night.
What I’d prefer to see is something similar to what CRM gave us:
earnings impulse → controlled pullback → support forms → continuation
That kind of structure can produce a much cleaner second-day or even multi-day trade than trying to catch the first after-hours candle.
Above the current structure, the 396 implied-move area becomes the obvious first major destination.
If AVGO gets through that area and continues building support rather than immediately rejecting, then 400+ becomes a legitimate expansion scenario.
That would be the fast version.
Yellow Scenario — Slower Recovery
Yellow may actually be the scenario I like almost as much as Green.
AVGO does not need to explode immediately for the setup to remain constructive.
It could spend time negotiating between roughly 365–378, absorb the earnings reaction, and gradually rebuild structure.
That slower path could look like:
hold lower support → reclaim 372 → test PDH / 378 → consolidate → continue
Sometimes that is the better trade.
A slower recovery gives us time to identify where buyers are actually defending price instead of reacting to a single earnings candle.
If AVGO remains above the lower structure and continues producing higher lows, I would keep the larger bullish thesis alive even if it takes several sessions to reach the upper implied-move area.
Red Scenario — Still on the Table
Red absolutely remains possible, but right now I grade it below Green and Yellow.
The first warning would be a loss of 365 / PDL.
Below there, AVGO has a cluster of Projected Areas of Agreement around:
362 → 359 → 358
That cluster matters.
If earnings produce a violent flush through those levels, I would not automatically treat that as a reason to chase puts.
That could actually create the other setup we’ve been studying:
overreaction → reclaim → reversal
If the entire 358–362 structure fails and price begins accepting beneath it, then the lower implied-move area around 342 becomes much more realistic.
What I’m Really Watching
I’m not trying to predict whether Broadcom beats earnings.
I’m trying to determine which post-earnings sequence develops.
Green: breakout, hold, continuation — potentially a multi-day runner like CRM.
Yellow: slower recovery, structure builds, continuation develops over several sessions.
Red: breakdown through support, with the possibility of either continued deterioration or an overreaction reclaim.
Right now I favor:
Green / Yellow > Red
But that weighting changes the second the market gives us different evidence.
The earnings number is information.
The reaction + structure is the trade.

Отказ от ответственности
Информация и публикации не предназначены для предоставления и не являются финансовыми, инвестиционными, торговыми или другими видами советов или рекомендаций, предоставленных или одобренных TradingView. Подробнее читайте в Условиях использования.
Отказ от ответственности
Информация и публикации не предназначены для предоставления и не являются финансовыми, инвестиционными, торговыми или другими видами советов или рекомендаций, предоставленных или одобренных TradingView. Подробнее читайте в Условиях использования.