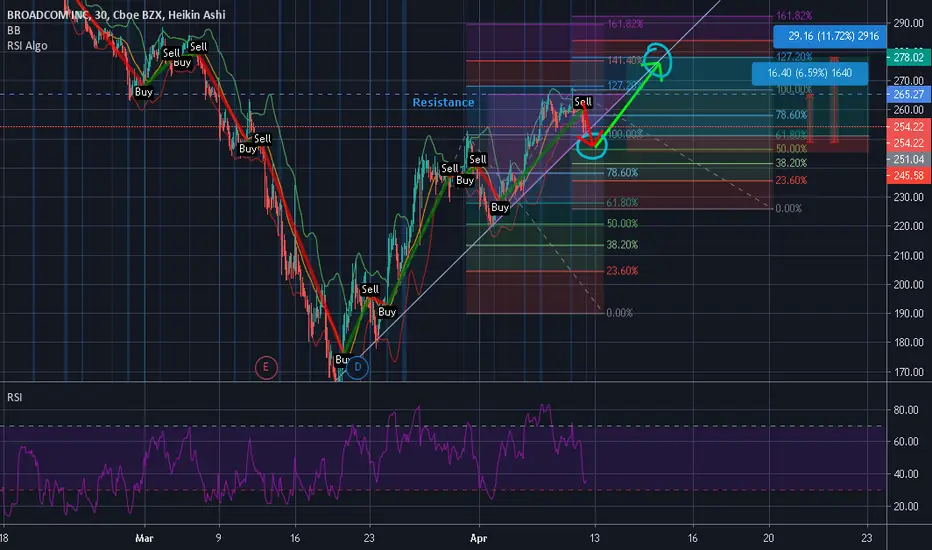
Technological stock  AVGO goes down and this is opportunity for LONG position.
The analysis based on Bollinger Bands (21,2) and RSI (30,70). We can see at 258$ the BB breakout when the RSI indicate to wait for more drop down.
Together with support trend line it's yield a strong buy at 254$.
Two scenarios are possible, the stock still goes down below 254$ , then RSI ALGO (8,65,35) will indicate the time to buy, otherwise the stock will start go up immediately to 278.02$ . This idea should not be considered a buy or sell recommendation.
AVGO goes down and this is opportunity for LONG position.The analysis based on Bollinger Bands (21,2) and RSI (30,70). We can see at 258$ the BB breakout when the RSI indicate to wait for more drop down.
Together with support trend line it's yield a strong buy at 254$.
Two scenarios are possible, the stock still goes down below 254$ , then RSI ALGO (8,65,35) will indicate the time to buy, otherwise the stock will start go up immediately to 278.02$ . This idea should not be considered a buy or sell recommendation.

Отказ от ответственности
Информация и публикации не предназначены для предоставления и не являются финансовыми, инвестиционными, торговыми или другими видами советов или рекомендаций, предоставленных или одобренных TradingView. Подробнее читайте в Условиях использования.
Отказ от ответственности
Информация и публикации не предназначены для предоставления и не являются финансовыми, инвестиционными, торговыми или другими видами советов или рекомендаций, предоставленных или одобренных TradingView. Подробнее читайте в Условиях использования.