
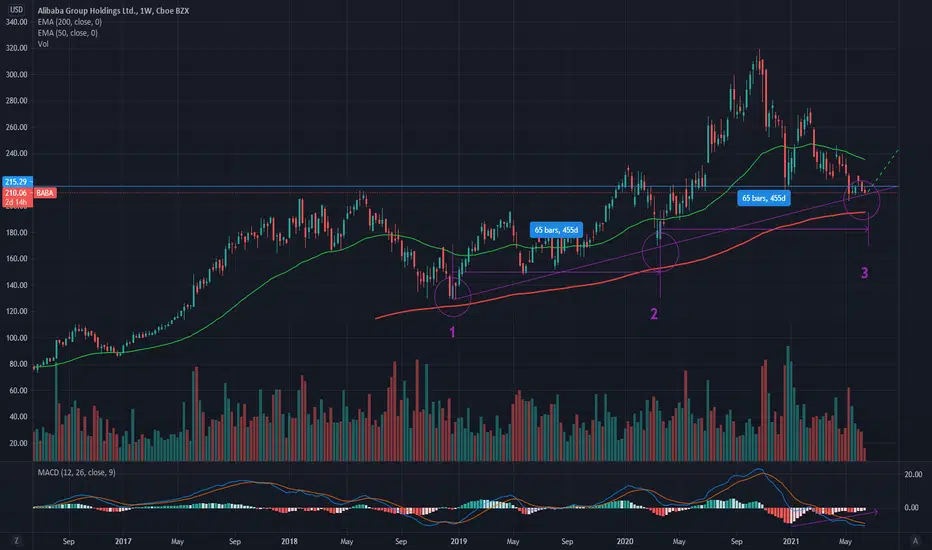
I am looking at BABA chart with MA200-day, MA50-day, MACD and Volume.
(Best to move chart to Week and Month to see clear MA proof)
It's interesting how BABA build candle over-and-over the green MA50.
I see 1-2-3 hits over the MA200 with upwards trend, looking for the date range,
we can see they're same numbers of days 455d/ 65bars.
I am looking forward to see a clear stock growth.
I am looking also to MACD and see an upwards trend.
(This is my way of thinking, please be carefully how you invest)
(Best to move chart to Week and Month to see clear MA proof)
It's interesting how BABA build candle over-and-over the green MA50.
I see 1-2-3 hits over the MA200 with upwards trend, looking for the date range,
we can see they're same numbers of days 455d/ 65bars.
I am looking forward to see a clear stock growth.
I am looking also to MACD and see an upwards trend.
(This is my way of thinking, please be carefully how you invest)

Отказ от ответственности
Информация и публикации не предназначены для предоставления и не являются финансовыми, инвестиционными, торговыми или другими видами советов или рекомендаций, предоставленных или одобренных TradingView. Подробнее читайте в Условиях использования.
Отказ от ответственности
Информация и публикации не предназначены для предоставления и не являются финансовыми, инвестиционными, торговыми или другими видами советов или рекомендаций, предоставленных или одобренных TradingView. Подробнее читайте в Условиях использования.