
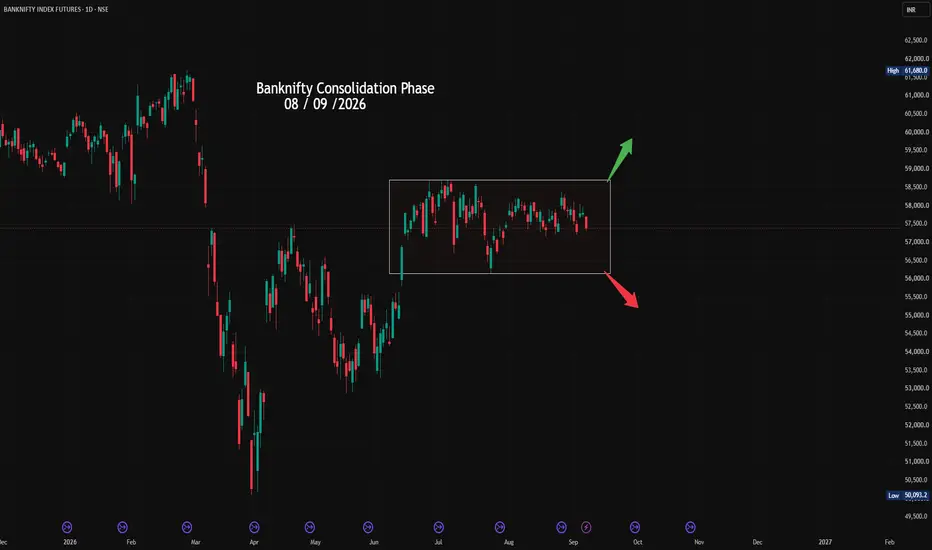
NSE India : Banknifty Daily chart Analyses
Bank Nifty Consolidation Phase and Structural Integrity: For the last 4 months, Bank Nifty has traded within a range, with a high of 58,650 and a low of 56,200
🔴 Major Resistance: 58,650
58,650 is the upper boundary of the established distribution/consolidation zone.
• Price has repeatedly approached this region without sustaining a breakout.
• Repeated rejection around this area indicates significant overhead supply.
• The upper boundary therefore acts as the key bullish trigger zone.
• A brief intraday penetration above 58,650 should not automatically be treated
as a breakout.
• The stronger confirmation would be a daily close above the zone, preferably accompanied
by expanding volume and follow-through.
🔴 Major Support: 56,200
56,200 is the primary lower boundary of the range and the critical demand/support zone.
• Previous reactions from this area establish its importance.
• Failure to hold this level would damage the current range structure.
• A decisive daily close below 56,200 would shift the market from range-bound → bearish
structural expansion.
Middle of range = (High range + Low Range)/ 2
(58,650 + 56,200) / 2 = 57,425
Current price is around 57,370, meaning Bank Nifty is almost exactly at the range equilibrium.
Bank Nifty Consolidation Phase and Structural Integrity: For the last 4 months, Bank Nifty has traded within a range, with a high of 58,650 and a low of 56,200
🔴 Major Resistance: 58,650
58,650 is the upper boundary of the established distribution/consolidation zone.
• Price has repeatedly approached this region without sustaining a breakout.
• Repeated rejection around this area indicates significant overhead supply.
• The upper boundary therefore acts as the key bullish trigger zone.
• A brief intraday penetration above 58,650 should not automatically be treated
as a breakout.
• The stronger confirmation would be a daily close above the zone, preferably accompanied
by expanding volume and follow-through.
🔴 Major Support: 56,200
56,200 is the primary lower boundary of the range and the critical demand/support zone.
• Previous reactions from this area establish its importance.
• Failure to hold this level would damage the current range structure.
• A decisive daily close below 56,200 would shift the market from range-bound → bearish
structural expansion.
Middle of range = (High range + Low Range)/ 2
(58,650 + 56,200) / 2 = 57,425
Current price is around 57,370, meaning Bank Nifty is almost exactly at the range equilibrium.

Website : ai-indicator.com WhatsApp : +919270007010
Telegram : t.me/+sgyahAbjk3YzYWJl
mail Id : satyambeed@gmail.com
Telegram : t.me/+sgyahAbjk3YzYWJl
mail Id : satyambeed@gmail.com
Отказ от ответственности
Информация и публикации не предназначены для предоставления и не являются финансовыми, инвестиционными, торговыми или другими видами советов или рекомендаций, предоставленных или одобренных TradingView. Подробнее читайте в Условиях использования.
Website : ai-indicator.com WhatsApp : +919270007010
Telegram : t.me/+sgyahAbjk3YzYWJl
mail Id : satyambeed@gmail.com
Telegram : t.me/+sgyahAbjk3YzYWJl
mail Id : satyambeed@gmail.com
Отказ от ответственности
Информация и публикации не предназначены для предоставления и не являются финансовыми, инвестиционными, торговыми или другими видами советов или рекомендаций, предоставленных или одобренных TradingView. Подробнее читайте в Условиях использования.