
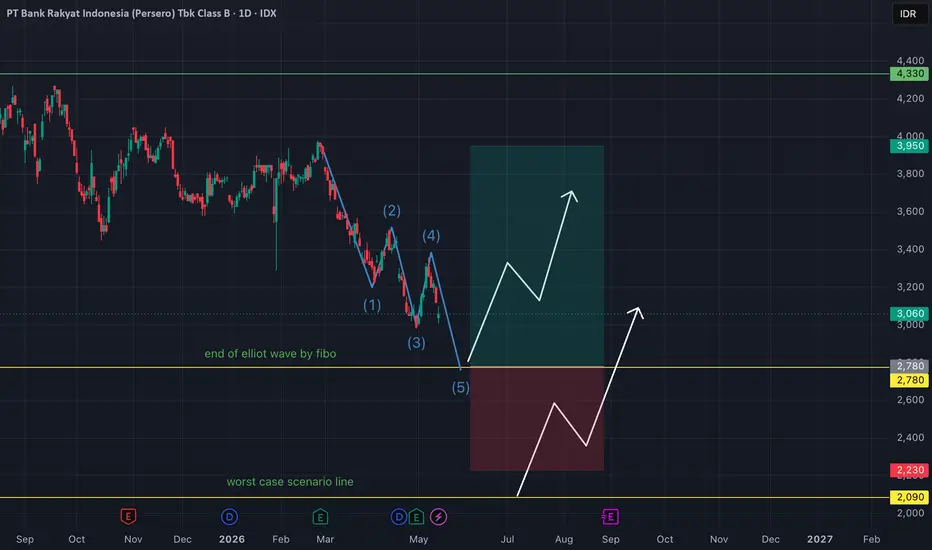
Based on my analysis, BBRI's current price movement is still in a downtrend. By applying the Elliott Wave cycle, I observe that the final wave has formed. This is also supported by Fibonacci analysis to identify potential price movements before entering a long position.
Going 'long' here is a speculative trade, not a long-term hold. It should be noted that a long entry must only be executed if it is supported by candlestick patterns such as a bullish engulfing, a star, or a hammer.
However, I have also mapped out a worst-case scenario in case the price continues its decline back to the levels seen during the COVID pandemic. Traders must remain vigilant if this worst-case scenario unfolds.
Going 'long' here is a speculative trade, not a long-term hold. It should be noted that a long entry must only be executed if it is supported by candlestick patterns such as a bullish engulfing, a star, or a hammer.
However, I have also mapped out a worst-case scenario in case the price continues its decline back to the levels seen during the COVID pandemic. Traders must remain vigilant if this worst-case scenario unfolds.

Отказ от ответственности
Информация и публикации не предназначены для предоставления и не являются финансовыми, инвестиционными, торговыми или другими видами советов или рекомендаций, предоставленных или одобренных TradingView. Подробнее читайте в Условиях использования.
Отказ от ответственности
Информация и публикации не предназначены для предоставления и не являются финансовыми, инвестиционными, торговыми или другими видами советов или рекомендаций, предоставленных или одобренных TradingView. Подробнее читайте в Условиях использования.