Длинная
BCH-FINALLY-Primary 5th (Extension)-Update
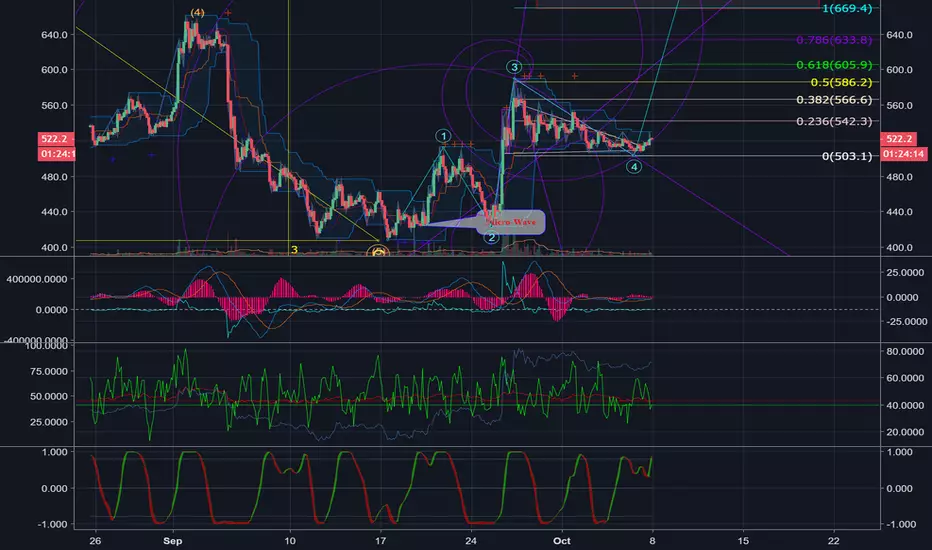
$BITFINEX:BCHUSD is finally beginning the extension of the 5th primary wave.
Analysis Method: Fibonacci & Elliot Wave
Review:
$BITFINEX:BCHUSD has been in a bear market since reaching an all-time high in December 2017 (273 days ago).
Weekly Chart:


1. Primary Wave Sequence (Green)
-Wave 1: +347.02%
-Wave 3: +899.29%
-Wave 5: +382.22%
- 133 Days
2. Correction Sequence (Yellow)
-A Wave: 5 Waves (Pink) (-84.87%)
-B Wave: 3 Waves (+197.89%)
-C Wave: 5 Waves (Orange) (-77.95%)
-Fib. Extension (5-A-B)
3. Fibonacci Extension: Wave 1 & Wave 2
4. Wave Sequence Price Increase: 2,290.84%
- $215.00/$4,104.30
- 133 Days
5. Wave 2 Price Decrease= 90.06%
- $4,104.30/$407.90
- 273 Days
6. Fibonacci Time Extension: Wave 1/Wave 5 (Yellow)

The Beginning:
Idea: BCH-BREAKOUT-Imminent
The Correction ended at $426.40 with a sharp reflex followed by a Micro-Wave sequence.
The Micro-Wave was a lower degree Wave 1 & Wave 2.
The 3rd Wave extended over 700% of Wave 1 & Wave 2.
The 4th Wave Correction resulted in what Elliot called a 'diagonal triangle'.
There are two main types of diagonal triangles. One is where the two boundaries of the triangle converge and the other where they diverge. The second type is known as Expanding Diagonal Triangles. Irrespective of whether they are converging or expanding diagonal triangles, if they occur in the first wave position, where they are known as ‘leading diagonal triangle’, the internal waves are made up of 5-3-5-3-5 sub waves. If they occur in the fifth wave position, they are known as ‘ending diagonal triangles’ and the internal waves are made up of 3-3-3-3-3 sub waves. For example, in an uptrend, the ending point of the fourth wave diagonal triangle will be near or even above the top of the third wave. Then all of a sudden, when the ‘e’ wave of the triangle is finished, price will break even higher and the fifth wave will race upwards.
The corrective sequence occurred in the Wave A position making it a leading diagonal.
When it occurs in Wave A position, it becomes a leading diagonal triangle, and when it occurs at the Wave C position, it is an ending diagonal triangle.
A diagonal triangle differs from a regular (horizontal) triangle in that it slopes in the direction of the trend. So when the eventual break out happens, the next move will be in the opposite direction.
The third wave traveled a considerable distance in a short space of time, and the diagonal triangle itself appeared sloping in the direction of the major trend which hints that the 5th Wave will extend.
The internal waves of the correction were 5-3-5.
The correction was also complex by having 2 correction sequences of ABCDE.
There was a total of 11 corrective sub-waves.


Wave 4: Price Range & Date Range

Wave Retracement:

-50%
-Weak Retrace for Higher Degree Wave 1
-Extending Higher Degree Wave 1?
Fib. Extension (0-3-4)

Primary Wave Sequence (Teal)
S-1: 25.36%
S-2: -17.53%
S-3: 39.25%
S-4: -14.73%


Terminal Wave 5 Target: $730 & $760
See Related for Additional Analysis. Will update.
Cheers,
-AB
Analysis Method: Fibonacci & Elliot Wave
Review:
$BITFINEX:BCHUSD has been in a bear market since reaching an all-time high in December 2017 (273 days ago).
Weekly Chart:
1. Primary Wave Sequence (Green)
-Wave 1: +347.02%
-Wave 3: +899.29%
-Wave 5: +382.22%
- 133 Days
2. Correction Sequence (Yellow)
-A Wave: 5 Waves (Pink) (-84.87%)
-B Wave: 3 Waves (+197.89%)
-C Wave: 5 Waves (Orange) (-77.95%)
-Fib. Extension (5-A-B)
3. Fibonacci Extension: Wave 1 & Wave 2
4. Wave Sequence Price Increase: 2,290.84%
- $215.00/$4,104.30
- 133 Days
5. Wave 2 Price Decrease= 90.06%
- $4,104.30/$407.90
- 273 Days
6. Fibonacci Time Extension: Wave 1/Wave 5 (Yellow)
The Beginning:
Idea: BCH-BREAKOUT-Imminent
The Correction ended at $426.40 with a sharp reflex followed by a Micro-Wave sequence.
The Micro-Wave was a lower degree Wave 1 & Wave 2.
The 3rd Wave extended over 700% of Wave 1 & Wave 2.
The 4th Wave Correction resulted in what Elliot called a 'diagonal triangle'.
There are two main types of diagonal triangles. One is where the two boundaries of the triangle converge and the other where they diverge. The second type is known as Expanding Diagonal Triangles. Irrespective of whether they are converging or expanding diagonal triangles, if they occur in the first wave position, where they are known as ‘leading diagonal triangle’, the internal waves are made up of 5-3-5-3-5 sub waves. If they occur in the fifth wave position, they are known as ‘ending diagonal triangles’ and the internal waves are made up of 3-3-3-3-3 sub waves. For example, in an uptrend, the ending point of the fourth wave diagonal triangle will be near or even above the top of the third wave. Then all of a sudden, when the ‘e’ wave of the triangle is finished, price will break even higher and the fifth wave will race upwards.
The corrective sequence occurred in the Wave A position making it a leading diagonal.
When it occurs in Wave A position, it becomes a leading diagonal triangle, and when it occurs at the Wave C position, it is an ending diagonal triangle.
A diagonal triangle differs from a regular (horizontal) triangle in that it slopes in the direction of the trend. So when the eventual break out happens, the next move will be in the opposite direction.
The third wave traveled a considerable distance in a short space of time, and the diagonal triangle itself appeared sloping in the direction of the major trend which hints that the 5th Wave will extend.
The internal waves of the correction were 5-3-5.
The correction was also complex by having 2 correction sequences of ABCDE.
There was a total of 11 corrective sub-waves.
Wave 4: Price Range & Date Range
Wave Retracement:
-50%
-Weak Retrace for Higher Degree Wave 1
-Extending Higher Degree Wave 1?
Fib. Extension (0-3-4)
Primary Wave Sequence (Teal)
S-1: 25.36%
S-2: -17.53%
S-3: 39.25%
S-4: -14.73%
Terminal Wave 5 Target: $730 & $760
See Related for Additional Analysis. Will update.
Cheers,
-AB
Заметка
Заметка
Will provide further analysis shortly.Travel day.
Заметка
Заметка
Extension?Заметка
Заметка
Lower Degree Sequence.Заметка
Заметка
LD Sequence1. Fib. Extension S-1 & S-2
-S-3 traveled beyond 1.618 (Extension)
2. Fib. Extension 0-3-4
-S-5 traveled approx. 1.618 (Extension)
Заметка
*S-5 traveled approx.1.382 (Extension)Заметка
Strong Micro-Wave.Заметка
Looks familiar...
Заметка
Snap up!Заметка
Leading DiagonalЗаметка
Заметка
Hyperbolic Time?Заметка
Заметка
Sub-Waves are hinting 5th Wave Extension.Higher Degree 3rd
-S-1 : Normal
-S-3 : Normal
Green Trend line - Extending 5th Trigger
Заметка
Higher Degree 3rd-S-5 Extended
Заметка
Заметка
Заметка
Correction Ending...Заметка
Always good to see to the bigger picture...
Заметка
Заметка
Do you see how the Higher Degree mocks the Lower Degree?Заметка
Заметка
Green box = LowerTeal box = Higher
Заметка
Заметка
Note: Red Arrow Spiral(s) convergenceЗаметка
Recent sell off is just weak hands...They will miss the snap higher...
Заметка
Заметка
Breakout Alert...Заметка
Заметка
Shot Calling Real-Time
Заметка
Заметка
Tiny Sub Sub Wave 1Заметка
Wave A-3Заметка
FLATЗаметка
Заметка
Note: Reflex (R>L)Заметка
Заметка
Заметка
FYI: Wave 1 is usually a sloppy formationЗаметка
Заметка
Заметка
*Sloppy
Заметка
Caught off sides?Заметка
Заметка
This is exactly what makes counting waves challenging. Large Buyers/Sellers create these long candles which sometimes violate Elliot's Rules.
Заметка
Exactly why Fibonacci Spirals are important along side wave analysis.Заметка
Заметка
This move is going to BIG!Заметка
Заметка
Excited yet?!Заметка
Заметка
Заметка
Wave AWave B
Wave C
Real-Time
Заметка
Заметка
Заметка
Wave 1 Formation:Note the long candle = Accumulation (Between Fib Time 3 & 5)
If the candle wasn't that long then Elliot's Rule regarding Wave 2 retrace wouldn't have been violated.
VOLUME! The higher the volume the cleaner the formations! Some traders have volume requirements for any given security that they trade (100K, 1M).
*But, Wave principles work regardless of Volume.
Заметка
Cannot stress the importance enough of the correlation of Lower & Higher Degrees!Key to Wave Analysis.
Заметка
Заметка
Spike/ComplexЗаметка
Заметка
T-20 minutes and holdingЗаметка
T-9 minutes and holdingЗаметка
Заметка
T-9 minutes and countingЗаметка
Main engine start (T-6.6 seconds)Заметка
Заметка
Lower Degree Wave:5th Extended
Higher Degree Wave:
?
Заметка
Заметка
Заметка
#SLOWWALKERЗаметка
Заметка
Заметка
Заметка
Заметка
Заметка
Заметка
Заметка
Заметка
Заметка
Заметка
Wave 1 & 2 CompleteЗаметка
3rd Wave-S1
-S2
Above
Заметка
Заметка
Заметка
Заметка
Above:Breaking above 50...
Заметка
Money will start flowing into crypto due to market sell off...Заметка
Заметка
Wave A - Bottomed in 3 WavesЗаметка
Noted in Blue (Only use ABC because there isn't a 123 sequence available)
Заметка
Заметка
Заметка
Lower = GreenHigher = Yellow
Заметка
Lower Retrace = .618Заметка
*Lower Retrace = .786Higher Retrace = .786
Заметка
Заметка
Заметка
Заметка
T-0Заметка
Заметка
Reminder: This is a Higher Degree Wave 1 that is extending.Заметка
Заметка
Wall Street Money Incoming in the next year...Заметка
Заметка
Заметка
The longly anticipated move has begun...Begin acceleration...
Заметка
Thesis: Monetary System Reset...
Fiat cannot survive...
Заметка
Careful: Reminder: Wave 1 is sloppy...
Standing by analysis...
Заметка
Заметка
Заметка
Next Few Minutes are key...
Заметка
Заметка
Reminder: Complex/SpikeЗаметка
Заметка
Заметка
Heart Dropped for a min...Заметка
Заметка
Big Money coming in...Заметка
Заметка
This almost looks like manipulation and a big player knocking down the price.Заметка
Заметка
Заметка
Careful shorting here...Заметка
Expecting a spike back up...Заметка
Заметка
Stop below 435.01Заметка
Money Flowing into crypto stocks...Заметка
Заметка
Заметка
BCH has bottomed. Forming support...
Analysis holds...
Заметка
Заметка
Заметка
Заметка
Заметка
Higher Wave 1 ExtendingЗаметка
Заметка
Заметка
Заметка
Strong move coming up...Заметка
Breakout Alert...Заметка
Working through STOPsЗаметка
Someone or Group is trying to hold this down...Just look at the book.
Заметка
A lot of buying, then blocks of STOPs.Заметка
STOPs being defeated.Заметка
Заметка
Заметка
Заметка
Заметка
Заметка
Заметка
All the same spirals.Заметка
If the price-action doesn’t spike and hold these spirals then it is a failed wave. There should be support here to hold.Заметка
Заметка
Заметка
No spike = No goodStaying Course.
Заметка
Заметка
Daily Needs to spike back...Заметка
Заметка
Заметка
Заметка
Заметка
Lower
Заметка
Заметка
Заметка
Заметка
Shorts need to start coveringЗаметка
Заметка
Заметка
One last time to test support...Заметка
Another 5-3 Sequence...Заметка
Заметка
Reminder: Daily Bar should spike all the way back up.Заметка
Заметка
Заметка
Заметка
Заметка
BOOM?Заметка
Заметка
Sub-Wave had an Extended 3rd....which should lead the higher degree to spike us up.Заметка
Заметка
Заметка
The Sets of 5-3 are STILL continuing...Заметка
Заметка
Заметка
Start the Clock...Заметка
15thЗаметка
Заметка
Say Goodbye to the $400-$500 price range...Заметка
Заметка
Заметка
Заметка
Reminder: This is a Leading Diagonal...Wave 4 CAN VIOLATE Wave 1
Заметка
Заметка
Заметка
Заметка
Заметка
Talk about EXTREME CONSOLIDATION!Заметка
Заметка
Sub-wave 5-3Заметка
Заметка
Заметка
Заметка
Заметка
Заметка
Заметка
Looks like a very merry Christmas...Заметка
Заметка
Shorts HAVE to COVER...Заметка
Strong setup
Заметка
Заметка
Заметка
Apologies for the long delay!!!!!!I knew we were bottoming but didn’t know exactly when the move higher would be!
Заметка
Boom, that’s the move I was talking about!Заметка
Creating a new idea to follow the move.Cheers,
-AB
Заметка
1.Shockwaves....2.Analysis....
3. BUY/COVER (6-9 AM EST)
Заметка
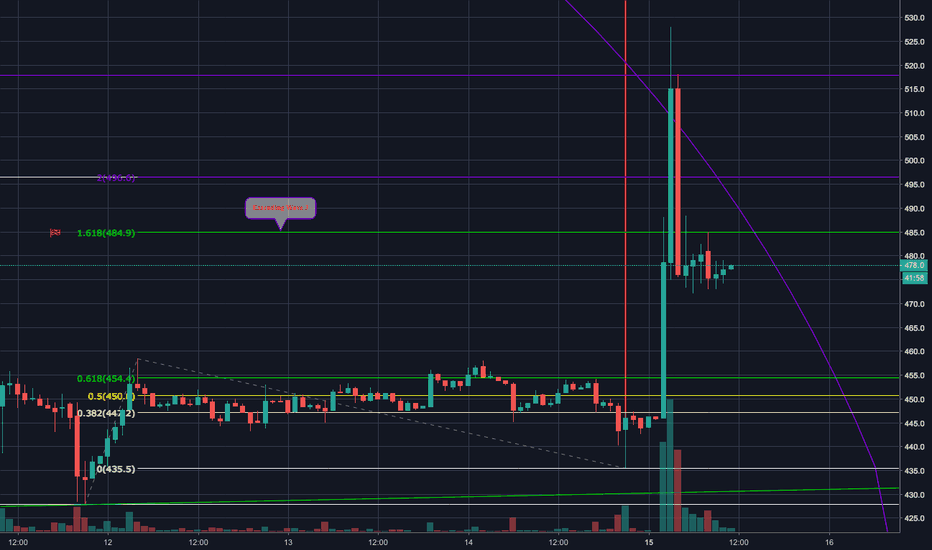
Сделка закрыта: достигнута тейк-профит цена

Похожие публикации
Отказ от ответственности
Информация и публикации не предназначены для предоставления и не являются финансовыми, инвестиционными, торговыми или другими видами советов или рекомендаций, предоставленных или одобренных TradingView. Подробнее читайте в Условиях использования.
Похожие публикации
Отказ от ответственности
Информация и публикации не предназначены для предоставления и не являются финансовыми, инвестиционными, торговыми или другими видами советов или рекомендаций, предоставленных или одобренных TradingView. Подробнее читайте в Условиях использования.