
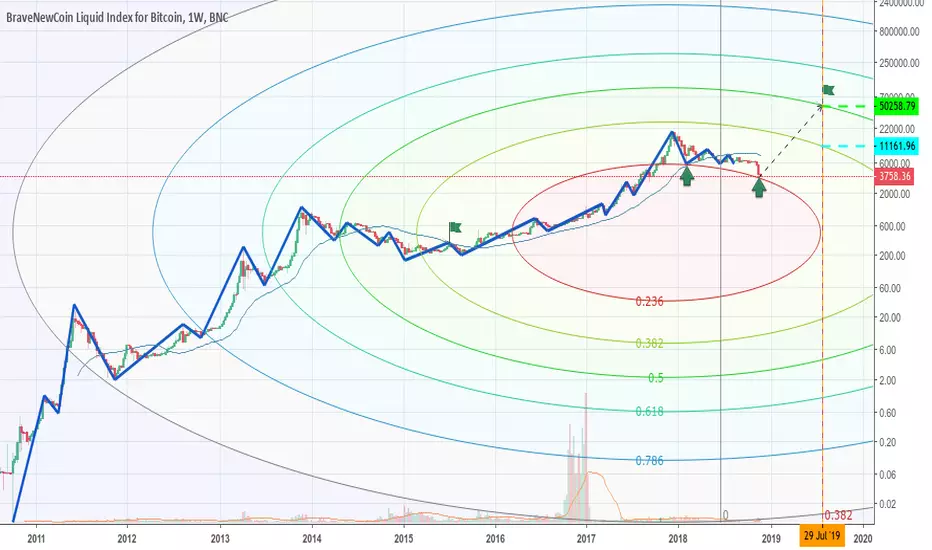
I saw people using this BNC to chart doom's day predictions and think about using it to do the inverse using a mix of circle fibs and extended time fibs. Extended time fibs is still a WIP on my toolbox, so I took the same ETF from the last crash and apply it to current crash in order to give me expected projection of when the next top market will happen and crossed it with my very accurate circle fib.
This is an optimist analysis with two possible outcomes, one very much on it's maximum and the other so so.
Btc is designed to get ripped and then explode on exponential swings so this view is based on repetition of this pattern.
If you liked my charts show some form of support so I continue posting.
Заметка
Market is starting to leave the red 0.382 curve, soon to take off !Заметка
As you can see the 0.382 circle fib is of great resistence right now
Похожие публикации
Отказ от ответственности
Информация и публикации не предназначены для предоставления и не являются финансовыми, инвестиционными, торговыми или другими видами советов или рекомендаций, предоставленных или одобренных TradingView. Подробнее читайте в Условиях использования.
Похожие публикации
Отказ от ответственности
Информация и публикации не предназначены для предоставления и не являются финансовыми, инвестиционными, торговыми или другими видами советов или рекомендаций, предоставленных или одобренных TradingView. Подробнее читайте в Условиях использования.