
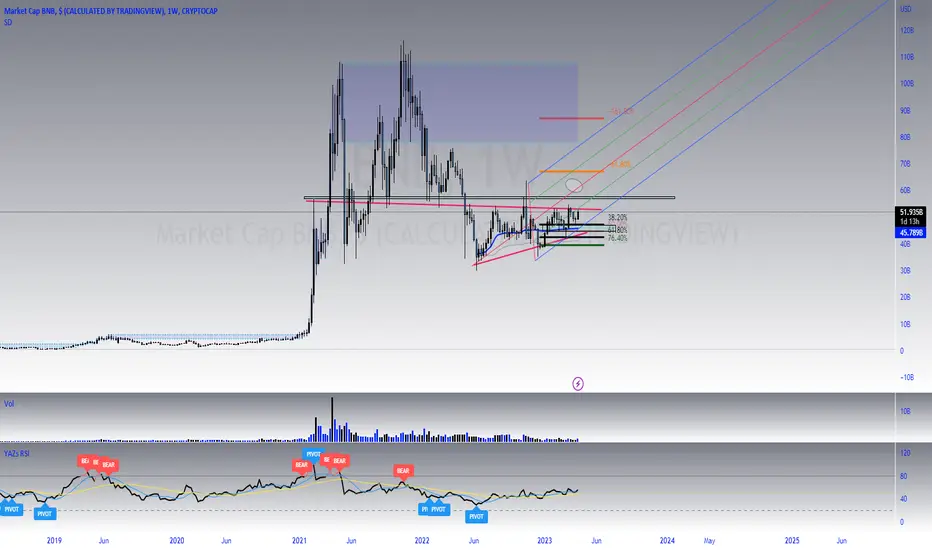
On the chart we can see a symmetrical triangle pattern, which is a neutral pattern meaning that it can breakout either to the upside or to the downside.
Enter the trade once the price breaks out of the triangle.
Look at the volume surge in order to avoid the false breakout.
Targets for long and for short are shown on the chart.
Enter the trade once the price breaks out of the triangle.
Look at the volume surge in order to avoid the false breakout.
Targets for long and for short are shown on the chart.

Отказ от ответственности
Информация и публикации не предназначены для предоставления и не являются финансовыми, инвестиционными, торговыми или другими видами советов или рекомендаций, предоставленных или одобренных TradingView. Подробнее читайте в Условиях использования.
Отказ от ответственности
Информация и публикации не предназначены для предоставления и не являются финансовыми, инвестиционными, торговыми или другими видами советов или рекомендаций, предоставленных или одобренных TradingView. Подробнее читайте в Условиях использования.