
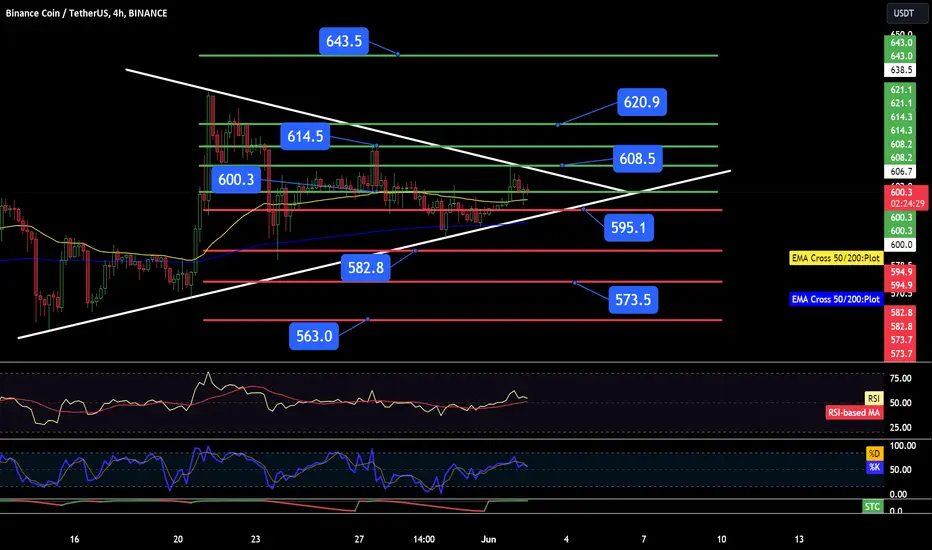
Hello everyone, let's take a look at the 4H BNB to USDT chart as we can see that we are getting close to trying to break out of the triangle.
Let's start by setting goals for the near future that we can include:
T1 = $600
T2 = $608.50
T3 = $614.50
T4 = $621
AND
T5 = $643.50
Now let's move on to the stop-loss in case of further market declines:
SL1 = $595
SL2 = $583
SL3 = $573.50
AND
SL4 = $563
When we look at the EMA Cross 50 and 200 indicator, we will see the yellow ema cross 50 line staying above the blue ema cross 200 line, which confirms that the uptrend is continuing.
Let's start by setting goals for the near future that we can include:
T1 = $600
T2 = $608.50
T3 = $614.50
T4 = $621
AND
T5 = $643.50
Now let's move on to the stop-loss in case of further market declines:
SL1 = $595
SL2 = $583
SL3 = $573.50
AND
SL4 = $563
When we look at the EMA Cross 50 and 200 indicator, we will see the yellow ema cross 50 line staying above the blue ema cross 200 line, which confirms that the uptrend is continuing.

Отказ от ответственности
Информация и публикации не предназначены для предоставления и не являются финансовыми, инвестиционными, торговыми или другими видами советов или рекомендаций, предоставленных или одобренных TradingView. Подробнее читайте в Условиях использования.
Отказ от ответственности
Информация и публикации не предназначены для предоставления и не являются финансовыми, инвестиционными, торговыми или другими видами советов или рекомендаций, предоставленных или одобренных TradingView. Подробнее читайте в Условиях использования.