
The Challenge: The Paradox of Choice
In a trending market, there are hundreds of potential setups. The manual process of checking the 30-week WMA, volume trends, and Mansfield Relative Strength (MRS) for every ticker on the ASX or S&P 500 is inefficient.
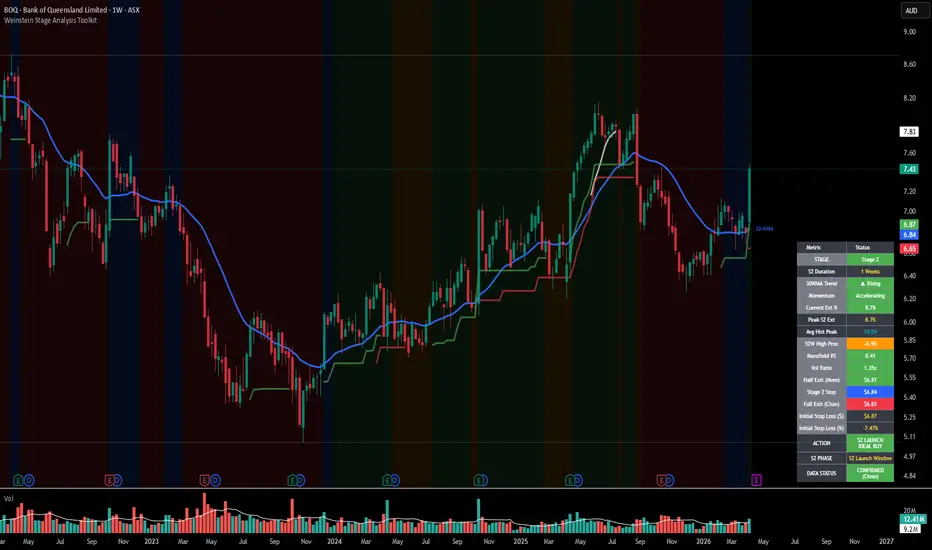
The SW Final Dash is designed to solve this by providing a high-level "Status Map" of your watchlist, allowing you to identify Stage 2 breakouts before they appear on the retail radar.
1. Understanding the Dashboard Status
The dashboard condenses complex technical requirements into a visual status. When using the Dash, focus on these three primary data points:
Stage Status: The dash identifies if the ticker is currently in Stage 1 (Base), Stage 2 (Advance), Stage 3 (Top), or Stage 4 (Decline).
The Trend Pillar: It monitors the slope of the 30-week Weighted Moving Average. A "Green" status across multiple timeframes indicates a high-conviction trend.
Relative Strength (MRS) Intensity: Rather than just a line, the dash shows whether the asset is gaining or losing momentum relative to the broader index.
2. How to Use the "Confluence" Filter
The most powerful way to use the Dash is to look for Confluence. A "perfect" Weinstein setup appears on the dashboard when:
Stage Change: The status flips from Stage 1 to Stage 2.
Volume Confirmation: The dash highlights a volume "surge" (relative to the 30-day average).
Positive MRS: The Relative Strength component turns green, indicating the stock is leading the market.
3. The Workflow: From Dash to Entry
Step 1 (Scan): Open your watchlist and look for "Stage 1" symbols that have a "Improving" Relative Strength status. These are your candidates for a breakout.
Step 2 (Alert): Set alerts based on the Dash’s transition logic. You want to be notified the moment a ticker moves into a "Stage 2 Confirmed" status.
Step 3 (Verify): Once the Dash flags a ticker, click the symbol to view the price action. Ensure the breakout is "clean" (above clear horizontal resistance) with the Dash showing all green pillars.
4. Managing the "Weight of Evidence"
The dashboard isn't just for entries; it’s for defense. If you are holding a Stage 2 position and the Dash begins to show "Stage 3" or "WMA Flattening" warnings, it is an objective signal to tighten your trailing stops or begin scaling out.
Best Practices for the Dashboard
Watchlist Sizing: The Dash works best with curated watchlists (e.g., Sector ETFs, ASX 200, or specific thematic lists).
Timeframe Alignment: Always ensure the Dash is pulling data from the Weekly timeframe for true Stage Analysis, even if you are viewing the daily chart for your entry.
The dashboard is a tool to assist in the Weinstein methodology with a few modern upgrades.
In a trending market, there are hundreds of potential setups. The manual process of checking the 30-week WMA, volume trends, and Mansfield Relative Strength (MRS) for every ticker on the ASX or S&P 500 is inefficient.
The SW Final Dash is designed to solve this by providing a high-level "Status Map" of your watchlist, allowing you to identify Stage 2 breakouts before they appear on the retail radar.
1. Understanding the Dashboard Status
The dashboard condenses complex technical requirements into a visual status. When using the Dash, focus on these three primary data points:
Stage Status: The dash identifies if the ticker is currently in Stage 1 (Base), Stage 2 (Advance), Stage 3 (Top), or Stage 4 (Decline).
The Trend Pillar: It monitors the slope of the 30-week Weighted Moving Average. A "Green" status across multiple timeframes indicates a high-conviction trend.
Relative Strength (MRS) Intensity: Rather than just a line, the dash shows whether the asset is gaining or losing momentum relative to the broader index.
2. How to Use the "Confluence" Filter
The most powerful way to use the Dash is to look for Confluence. A "perfect" Weinstein setup appears on the dashboard when:
Stage Change: The status flips from Stage 1 to Stage 2.
Volume Confirmation: The dash highlights a volume "surge" (relative to the 30-day average).
Positive MRS: The Relative Strength component turns green, indicating the stock is leading the market.
3. The Workflow: From Dash to Entry
Step 1 (Scan): Open your watchlist and look for "Stage 1" symbols that have a "Improving" Relative Strength status. These are your candidates for a breakout.
Step 2 (Alert): Set alerts based on the Dash’s transition logic. You want to be notified the moment a ticker moves into a "Stage 2 Confirmed" status.
Step 3 (Verify): Once the Dash flags a ticker, click the symbol to view the price action. Ensure the breakout is "clean" (above clear horizontal resistance) with the Dash showing all green pillars.
4. Managing the "Weight of Evidence"
The dashboard isn't just for entries; it’s for defense. If you are holding a Stage 2 position and the Dash begins to show "Stage 3" or "WMA Flattening" warnings, it is an objective signal to tighten your trailing stops or begin scaling out.
Best Practices for the Dashboard
Watchlist Sizing: The Dash works best with curated watchlists (e.g., Sector ETFs, ASX 200, or specific thematic lists).
Timeframe Alignment: Always ensure the Dash is pulling data from the Weekly timeframe for true Stage Analysis, even if you are viewing the daily chart for your entry.
The dashboard is a tool to assist in the Weinstein methodology with a few modern upgrades.

Отказ от ответственности
Информация и публикации не предназначены для предоставления и не являются финансовыми, инвестиционными, торговыми или другими видами советов или рекомендаций, предоставленных или одобренных TradingView. Подробнее читайте в Условиях использования.
Отказ от ответственности
Информация и публикации не предназначены для предоставления и не являются финансовыми, инвестиционными, торговыми или другими видами советов или рекомендаций, предоставленных или одобренных TradingView. Подробнее читайте в Условиях использования.