
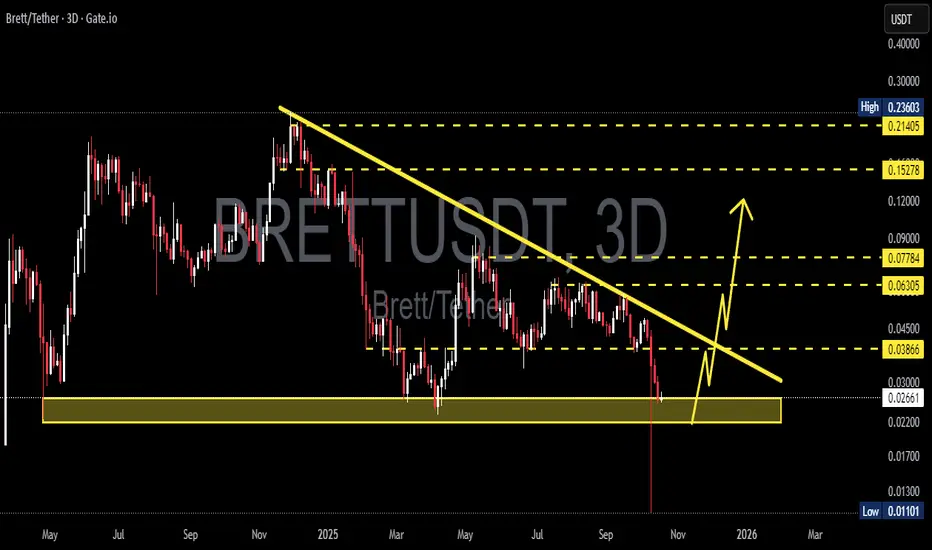
The 3D chart of BRETT/USDT is currently sitting at a critical juncture — right where a major horizontal support zone meets a long-term descending trendline.
This setup reflects the classic “moment of truth” in technical analysis — a key crossroads between a potential trend reversal or a continuation of bearish momentum.
At the time of analysis, the price is around 0.02639 USDT, positioned inside the strong demand zone at 0.022–0.0265, which has historically acted as a major accumulation area. The long wick down to 0.01101 indicates a possible liquidity sweep — a typical signal that weak hands have been flushed out, often followed by a relief rally or reversal phase.
However, the descending trendline continues to act as a strong dynamic resistance, compressing every attempt of upward momentum. As long as this trendline holds, sellers remain in control — but the persistence of this support zone suggests the potential for a major reversal base.
---
Pattern & Structure Overview
Main Pattern: Descending Triangle — lower highs compressing against a flat support line. While this pattern traditionally leans bearish, a failed breakdown from it can trigger a strong bullish reversal.
Liquidity Sweep (0.011): A deep wick likely cleared stop-loss clusters, meaning liquidity below support may already be exhausted.
Descending Trendline: Acts as the psychological “barrier” — a clean breakout above it could trigger a short squeeze.
Momentum: Seller pressure is slowing down near the support area; watch for increasing volume as a sign of accumulation.
---
Bullish Scenario (Reversal Potential)
If buyers continue to defend the 0.022–0.0265 zone, the market could be forming a structural bottom.
A bullish confirmation would require:
1. A clear break and 3D close above the descending trendline (around 0.03866).
2. A visible increase in trading volume, signaling strong buying participation.
3. Formation of a higher low above 0.026, confirming a shift in market structure.
Bullish Targets:
0.03866 → first breakout target
0.06305 → medium-term resistance
0.07784 → confirmation of full reversal
0.15278+ → potential expansion target if bullish momentum extends
---
Bearish Scenario (Breakdown Continuation)
If the price fails to hold above 0.022, especially with a confirmed 3D or weekly close below it:
Expect a continuation of the current distribution phase.
The market could retest the liquidity area near 0.011, or even form new lows if sell volume spikes.
Bearish Targets:
0.017–0.013 → potential short-term reaction zone.
Below 0.011 → opens the door for a deeper capitulation phase.
---
Conclusion
BRETT is currently standing on its final line of defense.
The 0.022–0.0265 zone is not just a regular support — it’s the stronghold for bulls and a potential entry point for smart money accumulation.
A breakout above the trendline could mark the beginning of a major trend reversal, while a breakdown below support could confirm a new leg down.
Given the current structure, BRETT is one of the most technically interesting assets to watch in the upcoming quarter — both for swing traders and long-term players.
---
#BRETT #CryptoAnalysis #MarketReversal #TrendlineBreak #CryptoTrading #SupportZone #BreakoutSetup #Downtrend #TechnicalAnalysis #SwingTrade #SmartMoney #LiquiditySweep
This setup reflects the classic “moment of truth” in technical analysis — a key crossroads between a potential trend reversal or a continuation of bearish momentum.
At the time of analysis, the price is around 0.02639 USDT, positioned inside the strong demand zone at 0.022–0.0265, which has historically acted as a major accumulation area. The long wick down to 0.01101 indicates a possible liquidity sweep — a typical signal that weak hands have been flushed out, often followed by a relief rally or reversal phase.
However, the descending trendline continues to act as a strong dynamic resistance, compressing every attempt of upward momentum. As long as this trendline holds, sellers remain in control — but the persistence of this support zone suggests the potential for a major reversal base.
---
Pattern & Structure Overview
Main Pattern: Descending Triangle — lower highs compressing against a flat support line. While this pattern traditionally leans bearish, a failed breakdown from it can trigger a strong bullish reversal.
Liquidity Sweep (0.011): A deep wick likely cleared stop-loss clusters, meaning liquidity below support may already be exhausted.
Descending Trendline: Acts as the psychological “barrier” — a clean breakout above it could trigger a short squeeze.
Momentum: Seller pressure is slowing down near the support area; watch for increasing volume as a sign of accumulation.
---
Bullish Scenario (Reversal Potential)
If buyers continue to defend the 0.022–0.0265 zone, the market could be forming a structural bottom.
A bullish confirmation would require:
1. A clear break and 3D close above the descending trendline (around 0.03866).
2. A visible increase in trading volume, signaling strong buying participation.
3. Formation of a higher low above 0.026, confirming a shift in market structure.
Bullish Targets:
0.03866 → first breakout target
0.06305 → medium-term resistance
0.07784 → confirmation of full reversal
0.15278+ → potential expansion target if bullish momentum extends
---
Bearish Scenario (Breakdown Continuation)
If the price fails to hold above 0.022, especially with a confirmed 3D or weekly close below it:
Expect a continuation of the current distribution phase.
The market could retest the liquidity area near 0.011, or even form new lows if sell volume spikes.
Bearish Targets:
0.017–0.013 → potential short-term reaction zone.
Below 0.011 → opens the door for a deeper capitulation phase.
---
Conclusion
BRETT is currently standing on its final line of defense.
The 0.022–0.0265 zone is not just a regular support — it’s the stronghold for bulls and a potential entry point for smart money accumulation.
A breakout above the trendline could mark the beginning of a major trend reversal, while a breakdown below support could confirm a new leg down.
Given the current structure, BRETT is one of the most technically interesting assets to watch in the upcoming quarter — both for swing traders and long-term players.
---
#BRETT #CryptoAnalysis #MarketReversal #TrendlineBreak #CryptoTrading #SupportZone #BreakoutSetup #Downtrend #TechnicalAnalysis #SwingTrade #SmartMoney #LiquiditySweep

✅ Get Free Signals! Join Our Telegram Channel Here: t.me/TheCryptoNuclear
✅ Twitter: twitter.com/crypto_nuclear
✅ Join Bybit : partner.bybit.com/b/nuclearvip
✅ Benefits : Lifetime Trading Fee Discount -50%
✅ Twitter: twitter.com/crypto_nuclear
✅ Join Bybit : partner.bybit.com/b/nuclearvip
✅ Benefits : Lifetime Trading Fee Discount -50%
Отказ от ответственности
Информация и публикации не предназначены для предоставления и не являются финансовыми, инвестиционными, торговыми или другими видами советов или рекомендаций, предоставленных или одобренных TradingView. Подробнее читайте в Условиях использования.
✅ Get Free Signals! Join Our Telegram Channel Here: t.me/TheCryptoNuclear
✅ Twitter: twitter.com/crypto_nuclear
✅ Join Bybit : partner.bybit.com/b/nuclearvip
✅ Benefits : Lifetime Trading Fee Discount -50%
✅ Twitter: twitter.com/crypto_nuclear
✅ Join Bybit : partner.bybit.com/b/nuclearvip
✅ Benefits : Lifetime Trading Fee Discount -50%
Отказ от ответственности
Информация и публикации не предназначены для предоставления и не являются финансовыми, инвестиционными, торговыми или другими видами советов или рекомендаций, предоставленных или одобренных TradingView. Подробнее читайте в Условиях использования.