
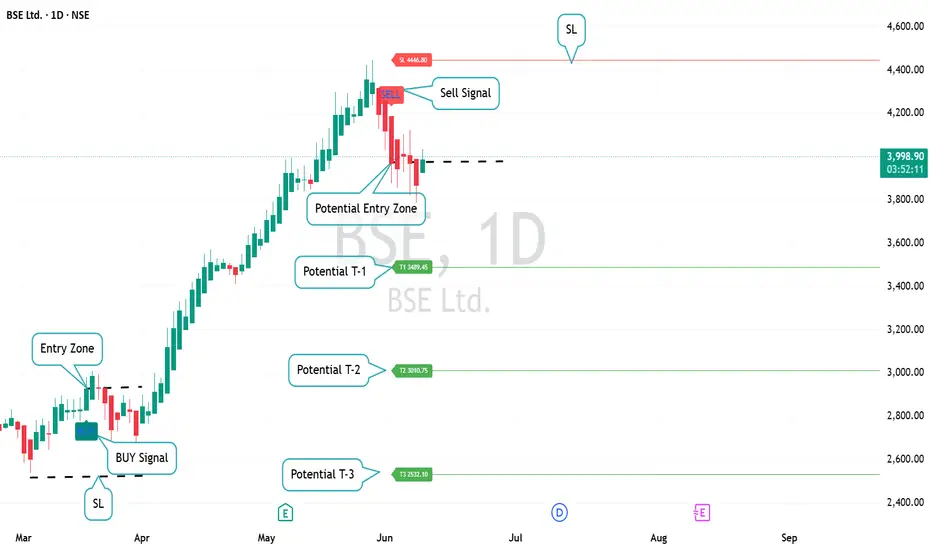
After a powerful rally from the ₹2,500–₹2,700 zone to above ₹4,300, BSE Ltd has finally generated a BTR PRO Sell Signal on the Daily timeframe. This does not necessarily mean the long-term uptrend is over, but it does suggest that the stock may enter a corrective or consolidation phase before the next major move.
Technical View
🔹 Current Price: ~₹4,000
🔹 BTR PRO Sell Signal: Active
🔹 Resistance Zone: ₹4,200 – ₹4,450
🔹 Potential Support Zones:
T1: ₹3,489
T2: ₹3,011
T3: ₹2,532
Investment Strategy
📌 Existing investors may consider partial profit booking after the massive rally.
📌 Fresh investors should avoid chasing prices near recent highs and wait for a correction toward stronger support levels.
📌 The ₹3,450–₹3,500 zone could become an attractive accumulation area if price action stabilizes there.
📌 A sustained move above ₹4,450 would invalidate the current bearish setup and indicate renewed bullish momentum.
INDICATOR Outlook
The BTR system has shifted from a bullish phase to a cautionary phase. Until a fresh Buy Signal appears, capital preservation and disciplined risk management should remain the priority.
Short-Term Bias: Bearish to Neutral 📉
Long-Term Bias: Bullish above major support zones 📈
Patience creates opportunity. Chasing creates risk.
#BSE #Investing #StockMarketIndia #TradingView #PriceAction #TechnicalAnalysis #BTRPRO #SwingTrading #LongTermInvesting #BKQuantDesk
Technical View
🔹 Current Price: ~₹4,000
🔹 BTR PRO Sell Signal: Active
🔹 Resistance Zone: ₹4,200 – ₹4,450
🔹 Potential Support Zones:
T1: ₹3,489
T2: ₹3,011
T3: ₹2,532
Investment Strategy
📌 Existing investors may consider partial profit booking after the massive rally.
📌 Fresh investors should avoid chasing prices near recent highs and wait for a correction toward stronger support levels.
📌 The ₹3,450–₹3,500 zone could become an attractive accumulation area if price action stabilizes there.
📌 A sustained move above ₹4,450 would invalidate the current bearish setup and indicate renewed bullish momentum.
INDICATOR Outlook
The BTR system has shifted from a bullish phase to a cautionary phase. Until a fresh Buy Signal appears, capital preservation and disciplined risk management should remain the priority.
Short-Term Bias: Bearish to Neutral 📉
Long-Term Bias: Bullish above major support zones 📈
Patience creates opportunity. Chasing creates risk.
#BSE #Investing #StockMarketIndia #TradingView #PriceAction #TechnicalAnalysis #BTRPRO #SwingTrading #LongTermInvesting #BKQuantDesk

Похожие публикации
Отказ от ответственности
Информация и публикации не предназначены для предоставления и не являются финансовыми, инвестиционными, торговыми или другими видами советов или рекомендаций, предоставленных или одобренных TradingView. Подробнее читайте в Условиях использования.
Похожие публикации
Отказ от ответственности
Информация и публикации не предназначены для предоставления и не являются финансовыми, инвестиционными, торговыми или другими видами советов или рекомендаций, предоставленных или одобренных TradingView. Подробнее читайте в Условиях использования.