
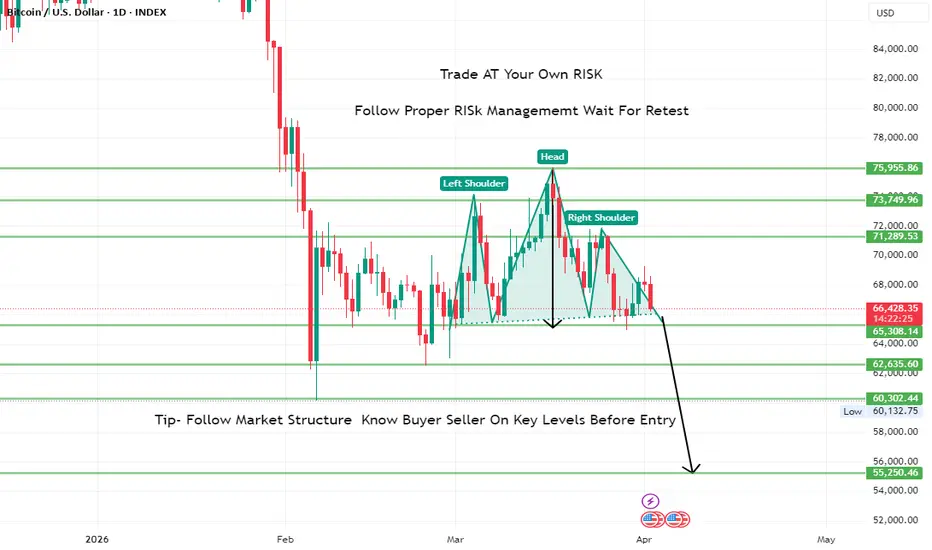
This study highlights how classical chart patterns and key levels help in understanding market behavior, especially during phases of distribution and potential trend shift.
🧩 Market Structure Overview (1D Timeframe)
On the daily chart, BTCUSD formed a clear Head & Shoulders pattern near major resistance, indicating a shift from bullish momentum to potential distribution phase.
Left Shoulder → Head → Right Shoulder formation reflects weakening buying strength
The neckline zone around 65,300–66,400 acts as a critical support level
Price is currently testing this area, making it a key decision zone
This structure suggests that the market is transitioning from trend continuation to possible correction phase.
🔍 Key Zones to Observe (Educational View)
Neckline / Immediate Support: 65,300 – 66,400
Intermediate Support: 62,600
Major Support Zone: 60,300
Extended Support Reference: 55,250
Resistance Zones: 71,200 – 75,900
These are reaction zones, not signals — observe how price behaves (rejection, consolidation, or breakout).
🧠 Expert Perspective – What the Market is Teaching
Head & Shoulders patterns reflect distribution by smart money
Breakdowns often come with retests and fake recoveries
Emotional traders react at the neckline, while disciplined traders wait for confirmation
This case reinforces a core principle:
“Structure reveals intention, but patience reveals clarity.”
📉📈 Directional Understanding (Educational)
If price sustains below neckline → indicates continuation of corrective phase
If price reclaims structure → suggests range continuation or delayed breakdown
The focus should remain on reaction at levels, not prediction of outcomes.
📘 Educational Takeaways
Patterns indicate probability, not certainty
Always combine structure with confirmation
Avoid emotional entries near key levels
Follow risk management and patience over impulsive decisions
⚠️ This analysis is for educational purposes only. Apply your own strategy and proper risk management before trading.
#BTCUSD #BitcoinAnalysis #CryptoTrading #TechnicalAnalysis #MarketStructure #HeadAndShoulders #TradingPsychology #RiskManagement #PriceAction #TradingEducation #YogirajTradingAcademy #MindfulTrading
🧩 Market Structure Overview (1D Timeframe)
On the daily chart, BTCUSD formed a clear Head & Shoulders pattern near major resistance, indicating a shift from bullish momentum to potential distribution phase.
Left Shoulder → Head → Right Shoulder formation reflects weakening buying strength
The neckline zone around 65,300–66,400 acts as a critical support level
Price is currently testing this area, making it a key decision zone
This structure suggests that the market is transitioning from trend continuation to possible correction phase.
🔍 Key Zones to Observe (Educational View)
Neckline / Immediate Support: 65,300 – 66,400
Intermediate Support: 62,600
Major Support Zone: 60,300
Extended Support Reference: 55,250
Resistance Zones: 71,200 – 75,900
These are reaction zones, not signals — observe how price behaves (rejection, consolidation, or breakout).
🧠 Expert Perspective – What the Market is Teaching
Head & Shoulders patterns reflect distribution by smart money
Breakdowns often come with retests and fake recoveries
Emotional traders react at the neckline, while disciplined traders wait for confirmation
This case reinforces a core principle:
“Structure reveals intention, but patience reveals clarity.”
📉📈 Directional Understanding (Educational)
If price sustains below neckline → indicates continuation of corrective phase
If price reclaims structure → suggests range continuation or delayed breakdown
The focus should remain on reaction at levels, not prediction of outcomes.
📘 Educational Takeaways
Patterns indicate probability, not certainty
Always combine structure with confirmation
Avoid emotional entries near key levels
Follow risk management and patience over impulsive decisions
⚠️ This analysis is for educational purposes only. Apply your own strategy and proper risk management before trading.
#BTCUSD #BitcoinAnalysis #CryptoTrading #TechnicalAnalysis #MarketStructure #HeadAndShoulders #TradingPsychology #RiskManagement #PriceAction #TradingEducation #YogirajTradingAcademy #MindfulTrading
Сделка закрыта: достигнута стоп-лосс цена

Отказ от ответственности
Информация и публикации не предназначены для предоставления и не являются финансовыми, инвестиционными, торговыми или другими видами советов или рекомендаций, предоставленных или одобренных TradingView. Подробнее читайте в Условиях использования.
Отказ от ответственности
Информация и публикации не предназначены для предоставления и не являются финансовыми, инвестиционными, торговыми или другими видами советов или рекомендаций, предоставленных или одобренных TradingView. Подробнее читайте в Условиях использования.