
1. Trend Overview: Bearish
The price is currently in a clear downtrend, confirmed by:
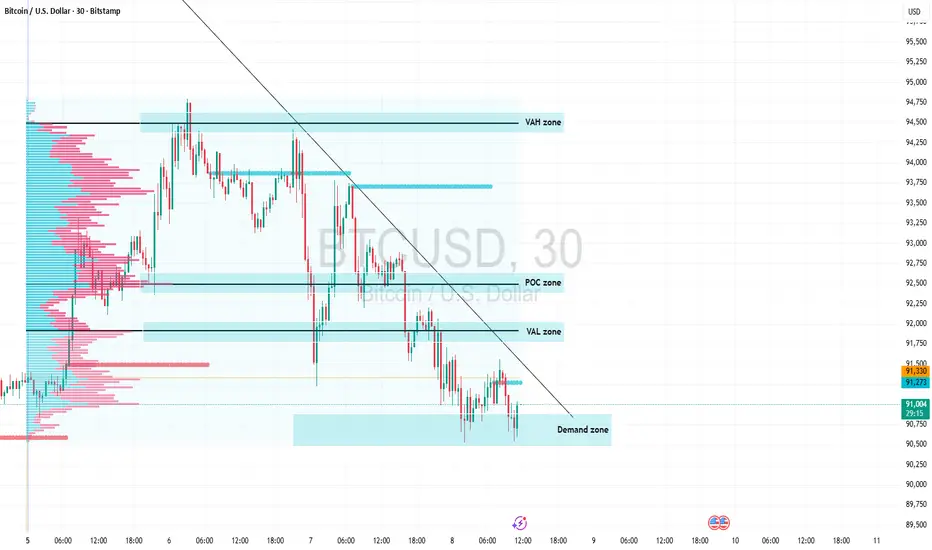
Descending Trendline: Price is consistently making lower highs and is hugging the diagonal trendline descending from the peak.
Position relative to Volume Profile: Price is trading entirely below the VAL (Value Area Low) at approximately . When price stays below the previous session's value area, it indicates that sellers are in control.
2. Key Technical Zones
Resistance Zones:
VAL ($91,800 - $92,000): This is a crucial psychological and technical barrier. Unless BTC breaks back above this level, it will remain under heavy selling pressure.
POC (Point of Control - ): The price level with the highest traded volume. This acts as a magnet for price, but currently serves as strong overhead resistance.
Support Zones:
Demand Zone ($90,500 - $90,800): Price is currently testing this zone. You can see long lower wicks forming, suggesting some buying interest (demand) is stepping in to prevent a drop below the mark.
3. Potential Scenarios
Scenario 1: Technical Rebound (Bullish Rebound)
If the current Demand Zone holds, we could see a relief rally to retest the descending trendline and the VAL ().
Condition: Needs a strong bullish candle closing above .
Target: $91,800 - .
Scenario 2: Further Decline (Bearish Continuation)
This is the higher probability scenario given the trendline pressure. If price breaks the Demand Zone (closes below ), BTC is likely to drop to lower levels:
Target 1: (Psychological level).
Target 2: (Previous support structure on the far left of the chart).
4. Trading Strategy
Avoid Longing the Dip blindly: Although price is at support, the primary trend is down. Only consider Long positions if there is a clear reversal pattern at the Demand Zone.
Prioritize Short setups: Look for sell opportunities on rallies toward the $91,800 - area if price shows rejection (long upper wicks) to trade in alignment with the main trend.
Observation: The current candle is sitting right at the edge of the Demand Zone. If there is not a strong bounce within the next 1-2 candles, a dump toward is highly probable.
The price is currently in a clear downtrend, confirmed by:
Descending Trendline: Price is consistently making lower highs and is hugging the diagonal trendline descending from the peak.
Position relative to Volume Profile: Price is trading entirely below the VAL (Value Area Low) at approximately . When price stays below the previous session's value area, it indicates that sellers are in control.
2. Key Technical Zones
Resistance Zones:
VAL ($91,800 - $92,000): This is a crucial psychological and technical barrier. Unless BTC breaks back above this level, it will remain under heavy selling pressure.
POC (Point of Control - ): The price level with the highest traded volume. This acts as a magnet for price, but currently serves as strong overhead resistance.
Support Zones:
Demand Zone ($90,500 - $90,800): Price is currently testing this zone. You can see long lower wicks forming, suggesting some buying interest (demand) is stepping in to prevent a drop below the mark.
3. Potential Scenarios
Scenario 1: Technical Rebound (Bullish Rebound)
If the current Demand Zone holds, we could see a relief rally to retest the descending trendline and the VAL ().
Condition: Needs a strong bullish candle closing above .
Target: $91,800 - .
Scenario 2: Further Decline (Bearish Continuation)
This is the higher probability scenario given the trendline pressure. If price breaks the Demand Zone (closes below ), BTC is likely to drop to lower levels:
Target 1: (Psychological level).
Target 2: (Previous support structure on the far left of the chart).
4. Trading Strategy
Avoid Longing the Dip blindly: Although price is at support, the primary trend is down. Only consider Long positions if there is a clear reversal pattern at the Demand Zone.
Prioritize Short setups: Look for sell opportunities on rallies toward the $91,800 - area if price shows rejection (long upper wicks) to trade in alignment with the main trend.
Observation: The current candle is sitting right at the edge of the Demand Zone. If there is not a strong bounce within the next 1-2 candles, a dump toward is highly probable.

Похожие публикации
Отказ от ответственности
Информация и публикации не предназначены для предоставления и не являются финансовыми, инвестиционными, торговыми или другими видами советов или рекомендаций, предоставленных или одобренных TradingView. Подробнее читайте в Условиях использования.
Похожие публикации
Отказ от ответственности
Информация и публикации не предназначены для предоставления и не являются финансовыми, инвестиционными, торговыми или другими видами советов или рекомендаций, предоставленных или одобренных TradingView. Подробнее читайте в Условиях использования.