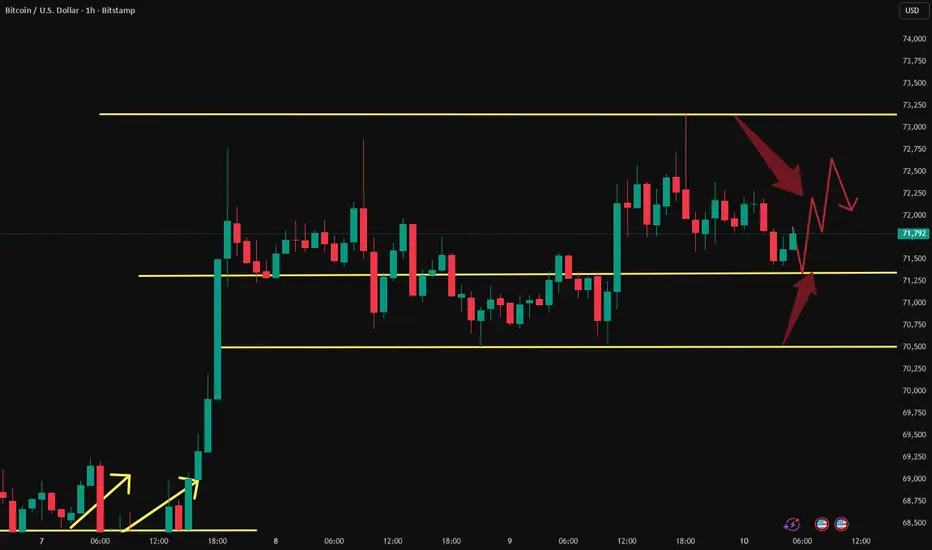
Currently, BTC price is fluctuating within a narrow range, exhibiting a typical "top above, bottom below" consolidation pattern.
Moving average system: The price is currently trading above the 20-period moving average (approximately $72,098) and the 50-period moving average (approximately $71,524). The 50-period EMA at $69,130 provides medium-term support, while the 200-period EMA at $68,656 forms a deeper retracement level.
MACD: Both the 1-hour and 4-hour charts are in a MACD death cross state, indicating that the bearish momentum is increasing and the medium-term upward trend has been interrupted.
RSI: The 4-hour RSI is above 50 (around 63.4), which is in the neutral to strong range overall, but there are signs of divergence, suggesting that the upward momentum may be weakening.
The 15-minute RSI is clearly trending upwards, indicating an overbought condition. Coupled with the MACD death cross and shrinking red bars, the short-term rebound is weak, and the overbought pullback signal is quite clear.
$70,500 is the current dividing line between bullish and bearish sentiment. This position is not only a buffer zone above the psychologically important psychological level of $70,000, but also a valid support zone that has been confirmed through multiple recent pullbacks. The $69,000–$70,000 range is a key support level; if this level is breached, BTC will face a deeper correction. If the price falls below $70,500, the next target is the $67,700–$69,000 range.
The core support level is $70,500, while the core resistance level is $73,000. Multi-period indicators suggest that after the rapid rise driven by previous positive factors, a pullback is more likely in the short term (target $71,500–$70,500). After confirming stabilization in the support area, the next direction will be determined.
The $70,500 level will be the most important watershed for the short-term trend: if it holds, the market will maintain a slightly bullish trend and may challenge $73,000–$75,000 after accumulating momentum; if it falls, the bullish structure will loosen and the market will seek deeper support around $68,000.
In terms of trading strategy, it is advisable to treat the current stage as a range-bound market, mainly using light positions to buy low and sell high, and wait for the price to effectively break through $73,000 or fall below $70,500 before following the trend.
 BTCUSD BTCUSD BTCUSD BTC1! BTCUSD
Moving average system: The price is currently trading above the 20-period moving average (approximately $72,098) and the 50-period moving average (approximately $71,524). The 50-period EMA at $69,130 provides medium-term support, while the 200-period EMA at $68,656 forms a deeper retracement level.
MACD: Both the 1-hour and 4-hour charts are in a MACD death cross state, indicating that the bearish momentum is increasing and the medium-term upward trend has been interrupted.
RSI: The 4-hour RSI is above 50 (around 63.4), which is in the neutral to strong range overall, but there are signs of divergence, suggesting that the upward momentum may be weakening.
The 15-minute RSI is clearly trending upwards, indicating an overbought condition. Coupled with the MACD death cross and shrinking red bars, the short-term rebound is weak, and the overbought pullback signal is quite clear.
$70,500 is the current dividing line between bullish and bearish sentiment. This position is not only a buffer zone above the psychologically important psychological level of $70,000, but also a valid support zone that has been confirmed through multiple recent pullbacks. The $69,000–$70,000 range is a key support level; if this level is breached, BTC will face a deeper correction. If the price falls below $70,500, the next target is the $67,700–$69,000 range.
The core support level is $70,500, while the core resistance level is $73,000. Multi-period indicators suggest that after the rapid rise driven by previous positive factors, a pullback is more likely in the short term (target $71,500–$70,500). After confirming stabilization in the support area, the next direction will be determined.
The $70,500 level will be the most important watershed for the short-term trend: if it holds, the market will maintain a slightly bullish trend and may challenge $73,000–$75,000 after accumulating momentum; if it falls, the bullish structure will loosen and the market will seek deeper support around $68,000.
In terms of trading strategy, it is advisable to treat the current stage as a range-bound market, mainly using light positions to buy low and sell high, and wait for the price to effectively break through $73,000 or fall below $70,500 before following the trend.
BTCUSD BTCUSD BTCUSD BTC1! BTCUSD 
Отказ от ответственности
Информация и публикации не предназначены для предоставления и не являются финансовыми, инвестиционными, торговыми или другими видами советов или рекомендаций, предоставленных или одобренных TradingView. Подробнее читайте в Условиях использования.
Отказ от ответственности
Информация и публикации не предназначены для предоставления и не являются финансовыми, инвестиционными, торговыми или другими видами советов или рекомендаций, предоставленных или одобренных TradingView. Подробнее читайте в Условиях использования.