
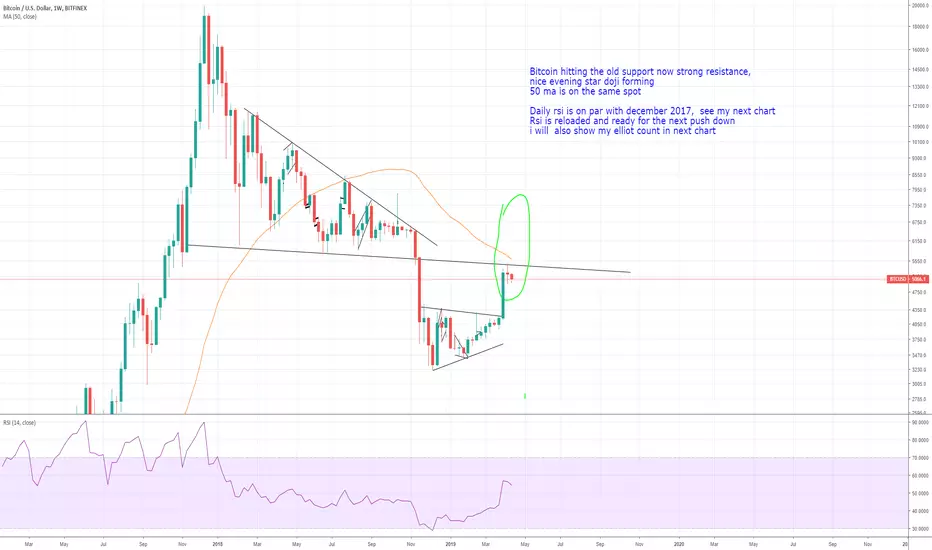
Looking @ the weekly chart of bitcoin we can see that we hit the trendline (old support) and just above there is the 50 ma. This would take a lot of power to break.
But looking @ the daily rsi which is on par with dec 2017 and the evening doji star forming on the weekly i dont see how bitcoin will brake this area now
my primairy elliot count:

Better be careull....
But looking @ the daily rsi which is on par with dec 2017 and the evening doji star forming on the weekly i dont see how bitcoin will brake this area now
my primairy elliot count:
Better be careull....

Отказ от ответственности
Информация и публикации не предназначены для предоставления и не являются финансовыми, инвестиционными, торговыми или другими видами советов или рекомендаций, предоставленных или одобренных TradingView. Подробнее читайте в Условиях использования.
Отказ от ответственности
Информация и публикации не предназначены для предоставления и не являются финансовыми, инвестиционными, торговыми или другими видами советов или рекомендаций, предоставленных или одобренных TradingView. Подробнее читайте в Условиях использования.