
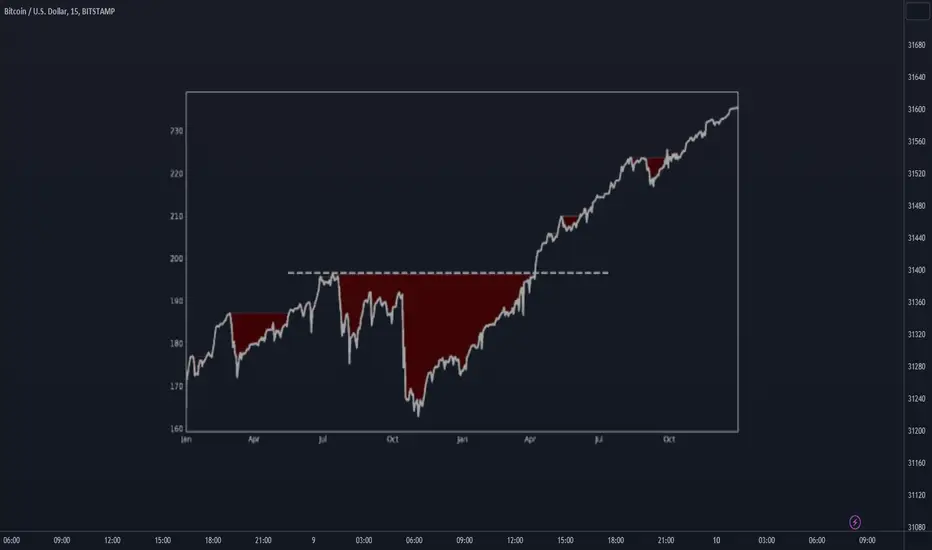
Drawdown is the metric used to measure the decline in a performance curve relative to a previous peak. It represents the distance between a maximum point in the capital curve and its subsequent minimum.
This indicator can be visualized in relative terms (%) or absolute terms (€, $...). In my opinion, I always recommend using relative data as it makes the analysis more intuitive.
From this concept arises the maximum drawdown of a strategy, which indicates the maximum percentage loss between a peak and a trough over a specific period of time. This period can range from the last month to the entire historical series, known as the drawdown from origin.
Therefore, drawdown is used in the risk assessment of a system, both on its own and in combination with other related measures that provide a higher degree of information.
This indicator can be visualized in relative terms (%) or absolute terms (€, $...). In my opinion, I always recommend using relative data as it makes the analysis more intuitive.
From this concept arises the maximum drawdown of a strategy, which indicates the maximum percentage loss between a peak and a trough over a specific period of time. This period can range from the last month to the entire historical series, known as the drawdown from origin.
Therefore, drawdown is used in the risk assessment of a system, both on its own and in combination with other related measures that provide a higher degree of information.
Сделка закрыта вручную

Отказ от ответственности
Информация и публикации не предназначены для предоставления и не являются финансовыми, инвестиционными, торговыми или другими видами советов или рекомендаций, предоставленных или одобренных TradingView. Подробнее читайте в Условиях использования.
Отказ от ответственности
Информация и публикации не предназначены для предоставления и не являются финансовыми, инвестиционными, торговыми или другими видами советов или рекомендаций, предоставленных или одобренных TradingView. Подробнее читайте в Условиях использования.