
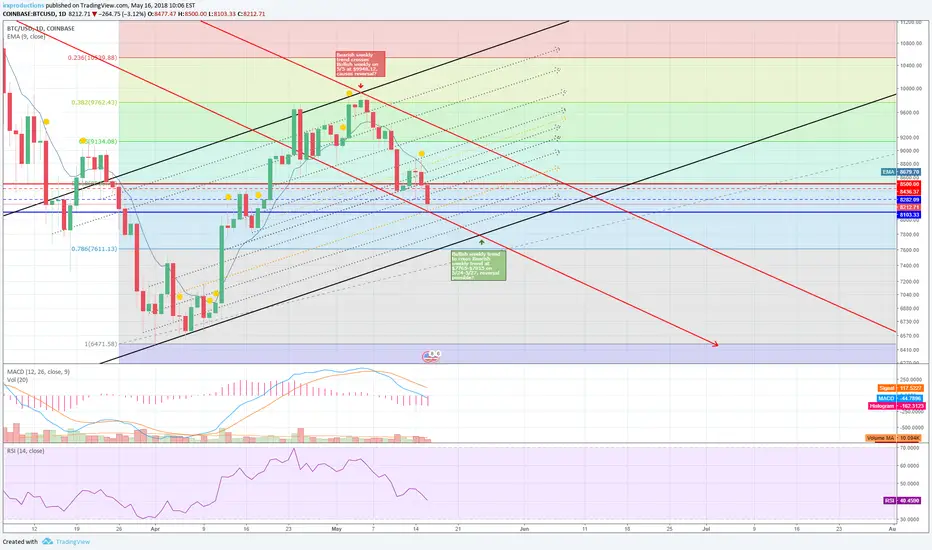
Looking at Bitcoin in the long-term using weekly trend lines, the recent Bearish reversal happened on 5/5 at a high of $9948.12 when a Bearish weekly trend (upper solid red) crossed with a Bullish weekly trend (upper black red).
Taking the theory to the next step, a lower Bearish weekly trend line (lower solid red) may cross with a lower Bullish weekly trend (lower solid black) between 5/24-5/27 at a rough price estimate of $7,765-$7,815.
Could this cause another reversal?
I'm still incredibly green at crypto Technical Analysis, so I'm hoping for to hear suggestions, ideas, and errors I may be making. Thanks, everyone!
Taking the theory to the next step, a lower Bearish weekly trend line (lower solid red) may cross with a lower Bullish weekly trend (lower solid black) between 5/24-5/27 at a rough price estimate of $7,765-$7,815.
Could this cause another reversal?
I'm still incredibly green at crypto Technical Analysis, so I'm hoping for to hear suggestions, ideas, and errors I may be making. Thanks, everyone!

Отказ от ответственности
Информация и публикации не предназначены для предоставления и не являются финансовыми, инвестиционными, торговыми или другими видами советов или рекомендаций, предоставленных или одобренных TradingView. Подробнее читайте в Условиях использования.
Отказ от ответственности
Информация и публикации не предназначены для предоставления и не являются финансовыми, инвестиционными, торговыми или другими видами советов или рекомендаций, предоставленных или одобренных TradingView. Подробнее читайте в Условиях использования.