
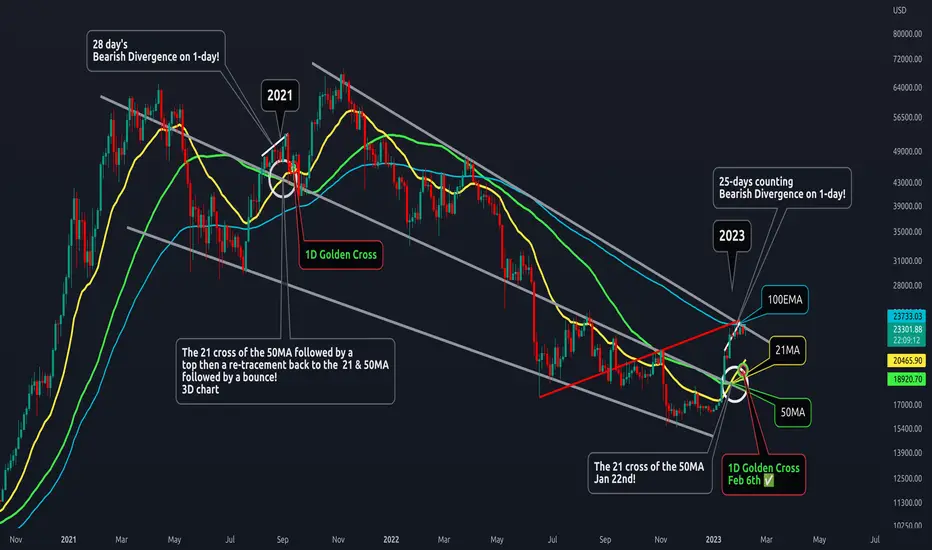
A follow on to our last 2 charts covering BTC's 3-day Pattern!
The 1-day Golden Cross has occurred and each time that it has in the past, BTC retraced just before or just after.
Also following the cross of the 21 Moving Average Crossing above the 50MA, BTC retraced back to the 50 as id did in 2021, and crashing through it in 2015 and 2020.
I have also noted that on the 1-day chart, BTC has been forming Bearish Divergence. 2021 was 28 days, current price action is 25-days!
Will BTC follow these past patterns or can it do the unexpected and break through our 100EMA and out-trend resistance?
The 1-day Golden Cross has occurred and each time that it has in the past, BTC retraced just before or just after.
Also following the cross of the 21 Moving Average Crossing above the 50MA, BTC retraced back to the 50 as id did in 2021, and crashing through it in 2015 and 2020.
I have also noted that on the 1-day chart, BTC has been forming Bearish Divergence. 2021 was 28 days, current price action is 25-days!
Will BTC follow these past patterns or can it do the unexpected and break through our 100EMA and out-trend resistance?
Заметка
Update: The Bearish Divergence was 27 days 2021 and 27 days 2023!
Отказ от ответственности
Информация и публикации не предназначены для предоставления и не являются финансовыми, инвестиционными, торговыми или другими видами советов или рекомендаций, предоставленных или одобренных TradingView. Подробнее читайте в Условиях использования.
Отказ от ответственности
Информация и публикации не предназначены для предоставления и не являются финансовыми, инвестиционными, торговыми или другими видами советов или рекомендаций, предоставленных или одобренных TradingView. Подробнее читайте в Условиях использования.