
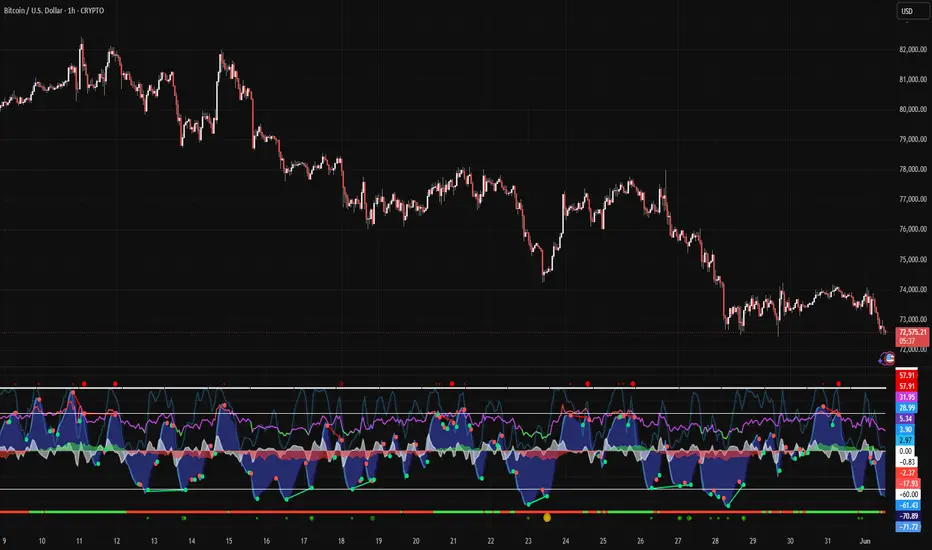
Bitcoin continues to trade under sustained selling pressure, with market structure remaining bearish across the recent swing sequence.
Since the middle of May, price has consistently produced lower highs and lower lows, a defining characteristic of a downtrend. While several relief rallies have occurred during this decline, none have been able to reclaim significant resistance levels or disrupt the broader bearish structure.
One interesting development is the behavior of momentum. Oscillator readings have recently pushed into deeply oversold territory, reaching levels that historically have often preceded short-term rebounds. Many traders interpret these signals as an immediate buying opportunity, but oversold conditions alone do not indicate a trend reversal.
Momentum indicators measure the speed of a move, not its direction.
In strong trends, markets can remain overbought or oversold for extended periods while price continues moving in the dominant direction. This is why oversold readings should be viewed as a warning that selling may be becoming stretched, rather than confirmation that buyers have regained control.
The key level to watch is the recent support zone around current lows. If buyers manage to defend this area and create a higher low, a relief rally toward previous resistance levels becomes increasingly likely.
However, if support breaks and sellers maintain control, the current downtrend structure remains intact and further downside expansion cannot be ruled out.

From a risk management perspective, this is often where traders make costly mistakes. After extended declines, many attempt to predict the exact bottom simply because price appears cheap relative to recent highs.
In reality, markets do not reverse because they have fallen enough. They reverse when buyers demonstrate the ability to absorb selling pressure and reclaim structure.
Until that happens, the current evidence continues to favor caution.
For now, the chart presents a simple question:
Is Bitcoin building a base for recovery, or simply pausing before the next leg lower?
The answer will likely come from price action around current support, not from momentum readings alone.
Since the middle of May, price has consistently produced lower highs and lower lows, a defining characteristic of a downtrend. While several relief rallies have occurred during this decline, none have been able to reclaim significant resistance levels or disrupt the broader bearish structure.
One interesting development is the behavior of momentum. Oscillator readings have recently pushed into deeply oversold territory, reaching levels that historically have often preceded short-term rebounds. Many traders interpret these signals as an immediate buying opportunity, but oversold conditions alone do not indicate a trend reversal.
Momentum indicators measure the speed of a move, not its direction.
In strong trends, markets can remain overbought or oversold for extended periods while price continues moving in the dominant direction. This is why oversold readings should be viewed as a warning that selling may be becoming stretched, rather than confirmation that buyers have regained control.
The key level to watch is the recent support zone around current lows. If buyers manage to defend this area and create a higher low, a relief rally toward previous resistance levels becomes increasingly likely.
However, if support breaks and sellers maintain control, the current downtrend structure remains intact and further downside expansion cannot be ruled out.
From a risk management perspective, this is often where traders make costly mistakes. After extended declines, many attempt to predict the exact bottom simply because price appears cheap relative to recent highs.
In reality, markets do not reverse because they have fallen enough. They reverse when buyers demonstrate the ability to absorb selling pressure and reclaim structure.
Until that happens, the current evidence continues to favor caution.
For now, the chart presents a simple question:
Is Bitcoin building a base for recovery, or simply pausing before the next leg lower?
The answer will likely come from price action around current support, not from momentum readings alone.

Похожие публикации
Отказ от ответственности
Информация и публикации не предназначены для предоставления и не являются финансовыми, инвестиционными, торговыми или другими видами советов или рекомендаций, предоставленных или одобренных TradingView. Подробнее читайте в Условиях использования.
Похожие публикации
Отказ от ответственности
Информация и публикации не предназначены для предоставления и не являются финансовыми, инвестиционными, торговыми или другими видами советов или рекомендаций, предоставленных или одобренных TradingView. Подробнее читайте в Условиях использования.