
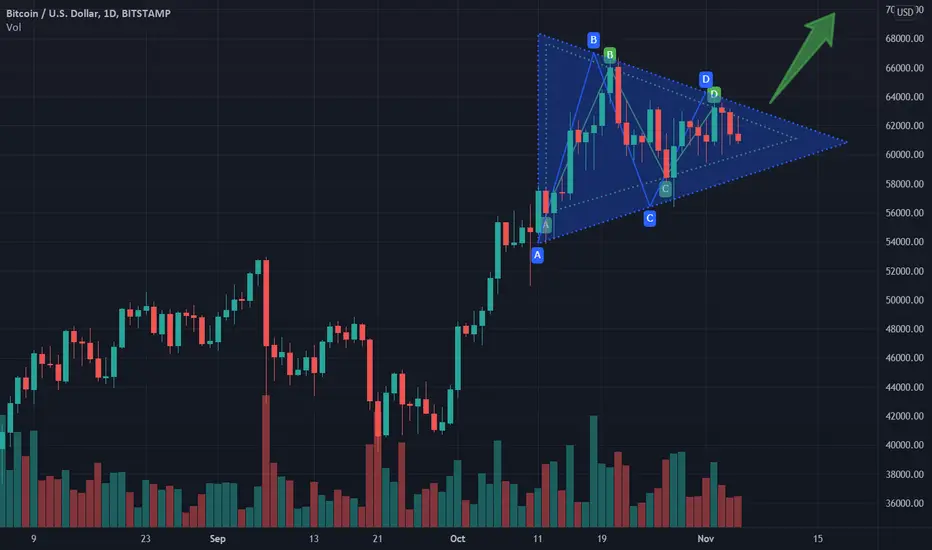
Keep It Simple Stupid - also in Bitcoin.
I've drawn a triangle over the chart in D1 and a bigger triangle in W1. Using only the daily resp. weekly closing prices. And this triangle looks valid to me.
I've seen people drawing wedges or flags in the charts but the triangle is a more reliable chart pattern. So it may take a few days in the daily chart or 1-2 weeks in the weekly chart until this formation gets resolved but it will get resolved finally. ;)
And yes, it's more likely that symmetric triangles get broken to the upside. I think then we see 75k as the next stop.
I've drawn a triangle over the chart in D1 and a bigger triangle in W1. Using only the daily resp. weekly closing prices. And this triangle looks valid to me.
I've seen people drawing wedges or flags in the charts but the triangle is a more reliable chart pattern. So it may take a few days in the daily chart or 1-2 weeks in the weekly chart until this formation gets resolved but it will get resolved finally. ;)
And yes, it's more likely that symmetric triangles get broken to the upside. I think then we see 75k as the next stop.
Заметка
The triangle pattern drawn on the daily timeframe has to break at the latest on Thursday - so only a few days left to wait. 🍾Заметка
Went faster than yesterday expected. But yes - that's the way. We're temporarily stuck at the closing high of the ATH candle but I don't expect a major resistance here. If we don't overcome this level even today than it will be surely broken during the next days.
Отказ от ответственности
Информация и публикации не предназначены для предоставления и не являются финансовыми, инвестиционными, торговыми или другими видами советов или рекомендаций, предоставленных или одобренных TradingView. Подробнее читайте в Условиях использования.
Отказ от ответственности
Информация и публикации не предназначены для предоставления и не являются финансовыми, инвестиционными, торговыми или другими видами советов или рекомендаций, предоставленных или одобренных TradingView. Подробнее читайте в Условиях использования.