
Hello, dear subscribers!
The market volatility measurement is a very important for the trading strategies constructing. One of the most appropriate and effective way to do it is to use the Average True Range (ATR) indicator.
How to calculate ATR?
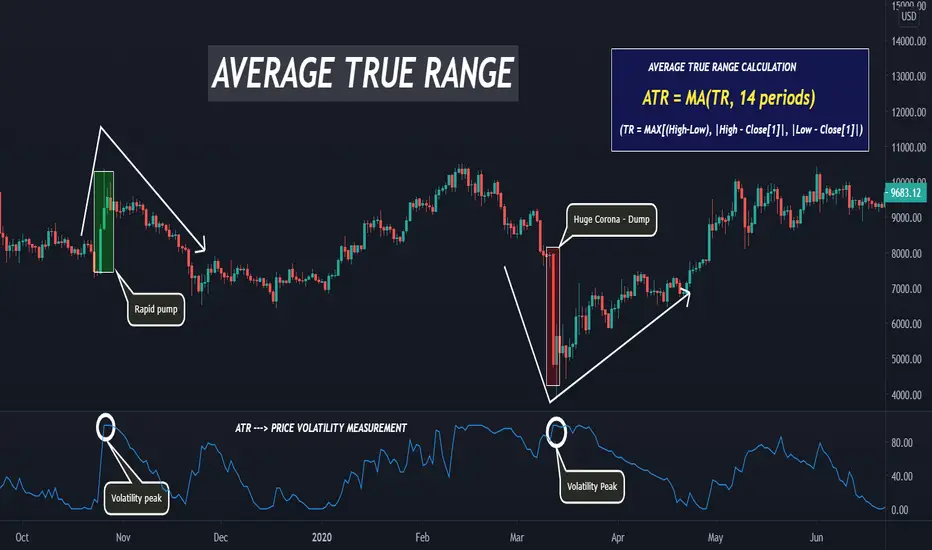
First of all we should receive True Range value and calculate it's moving average on 14 periods. The True Range is a maximum of three values:
1. High - Low
2. Absolute value of (High - Previous candle close)
3. Absolute value of (Low - Previous candle close)
Thus, this indicator takes into account not only the current candle prices, also for the previous candle.
How to use it?
This indicator can't help to define the future price action direction but it can be very useful in combination with other indicators. The most appropriate way is to combine it with any oscillator. The oscillator will help you to identify the overbought and oversold conditions or bullish/bearish divergences, as a result you can define the direction of potential price move. The ATR will define the best entry point when the price on the minimum/maximum level.
ATR is greatly triggered on huge pumps and dumps, as you can see on the chart after that price usually has a correction which can be used in your trades.
DISCLAMER: Information is provided only for educational purposes. Do your own study before taking any actions or decisions.
The market volatility measurement is a very important for the trading strategies constructing. One of the most appropriate and effective way to do it is to use the Average True Range (ATR) indicator.
How to calculate ATR?
First of all we should receive True Range value and calculate it's moving average on 14 periods. The True Range is a maximum of three values:
1. High - Low
2. Absolute value of (High - Previous candle close)
3. Absolute value of (Low - Previous candle close)
Thus, this indicator takes into account not only the current candle prices, also for the previous candle.
How to use it?
This indicator can't help to define the future price action direction but it can be very useful in combination with other indicators. The most appropriate way is to combine it with any oscillator. The oscillator will help you to identify the overbought and oversold conditions or bullish/bearish divergences, as a result you can define the direction of potential price move. The ATR will define the best entry point when the price on the minimum/maximum level.
ATR is greatly triggered on huge pumps and dumps, as you can see on the chart after that price usually has a correction which can be used in your trades.
DISCLAMER: Information is provided only for educational purposes. Do your own study before taking any actions or decisions.

Turn TradingView indicator & strategy alerts into automated trades on major crypto exchanges using no-code bots
Start free at skyrexio.com
Start free at skyrexio.com
Отказ от ответственности
Информация и публикации не предназначены для предоставления и не являются финансовыми, инвестиционными, торговыми или другими видами советов или рекомендаций, предоставленных или одобренных TradingView. Подробнее читайте в Условиях использования.
Turn TradingView indicator & strategy alerts into automated trades on major crypto exchanges using no-code bots
Start free at skyrexio.com
Start free at skyrexio.com
Отказ от ответственности
Информация и публикации не предназначены для предоставления и не являются финансовыми, инвестиционными, торговыми или другими видами советов или рекомендаций, предоставленных или одобренных TradingView. Подробнее читайте в Условиях использования.