
Don't know any TA, especially not Fib Channels & Logarithmic Growth Curves.
Meaning, this chart is likely technically wrong (comment on my errors if so).
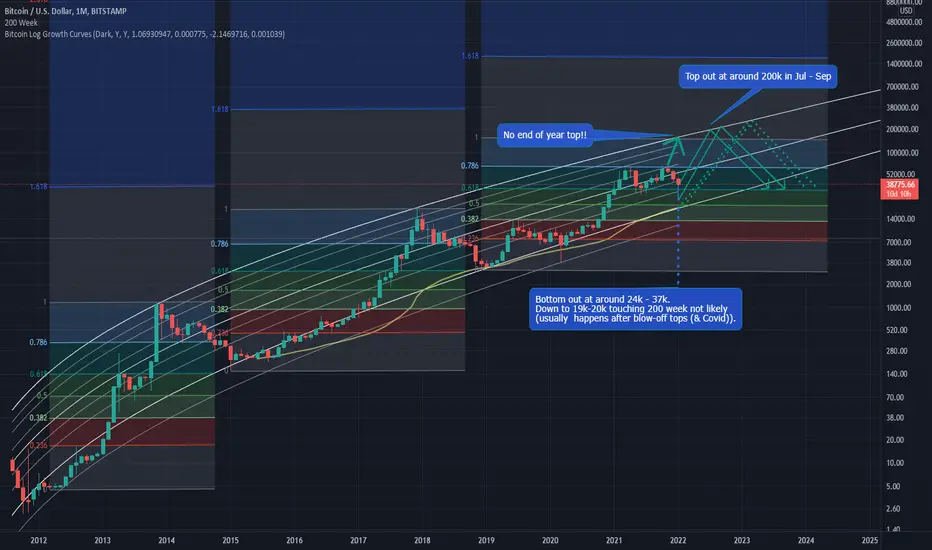
Anyway, accoring to this amazing chart Bitcoin might bottom out by the end of this month (or beginning of February) at around 37k - 24k.
And then continue to top out at about 200k in July - September.
Followed by a bear market that may bottom a year later at around 30k.
Meaning, this chart is likely technically wrong (comment on my errors if so).
Anyway, accoring to this amazing chart Bitcoin might bottom out by the end of this month (or beginning of February) at around 37k - 24k.
And then continue to top out at about 200k in July - September.
Followed by a bear market that may bottom a year later at around 30k.

Отказ от ответственности
Информация и публикации не предназначены для предоставления и не являются финансовыми, инвестиционными, торговыми или другими видами советов или рекомендаций, предоставленных или одобренных TradingView. Подробнее читайте в Условиях использования.
Отказ от ответственности
Информация и публикации не предназначены для предоставления и не являются финансовыми, инвестиционными, торговыми или другими видами советов или рекомендаций, предоставленных или одобренных TradingView. Подробнее читайте в Условиях использования.