
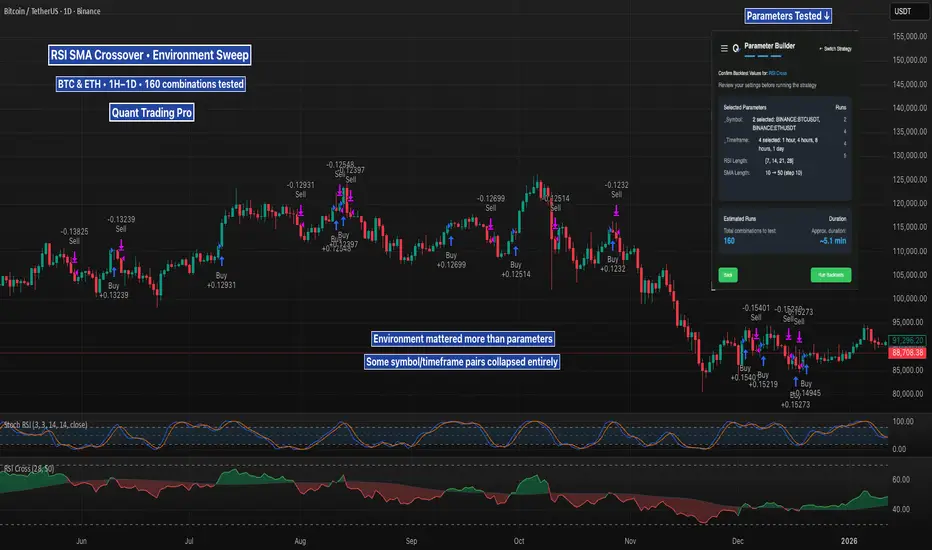
The RSI SMA crossover is a simple and widely used TradingView strategy, often assumed to behave consistently once “good” parameters are selected. Rather than evaluating it on a single symbol or timeframe, I tested how the same logic performs across different market environments.
For this test, I ran a parameter sweep across multiple symbols and timeframes, keeping the strategy logic fixed while varying only RSI length and SMA length within reasonable ranges. The test covered BTCUSDT and ETHUSDT across 4H, 1D, 3D, and 1W timeframes, resulting in 160 total combinations.
The goal was not to find a single optimal configuration, but to observe whether performance is driven more by indicator parameters or by the trading environment itself.
Representative Results (Risk-Adjusted)
Below are four configurations that best illustrate the results and support the overall conclusions. These were selected for balance between profitability, drawdown, and trade frequency rather than headline return alone.
1) BTCUSDT — 1D (Most Stable Overall)
RSI Length: 28
SMA Length: 50
Profit Factor: ~1.77
Trades: ~109
This configuration showed the most consistent risk-adjusted behavior across nearby parameter sets and was less sensitive to small changes than others.
2) BTCUSDT — 1D (Lower Drawdown Variant)
RSI Length: 21
SMA Length: 50
Profit Factor: ~1.70
Trades: ~121
Slightly lower profitability than the first configuration, but meaningfully lower drawdown, highlighting a trade-off between responsiveness and stability.
3) ETHUSDT — 1D (Best ETH Environment)
RSI Length: 28
SMA Length: 40
Profit Factor: ~1.55–1.60
Trades: ~110–120
ETH showed acceptable performance on the daily timeframe, but drawdowns were consistently higher than BTC under similar settings.
4) BTCUSDT — 4H (Higher Activity, Lower Stability)
RSI Length: 28
SMA Length: 40
Profit Factor: ~1.55–1.60
Trades: 400+
Lower timeframes increased trade frequency substantially but introduced significantly more drawdown and instability.
Takeaway
Across all tests, performance varied far more by symbol and timeframe than by RSI or SMA length. Small parameter changes often mattered less than the environment the strategy was applied to. Some symbol/timeframe combinations remained relatively stable, while others deteriorated quickly despite using identical logic.
The broader takeaway is that strategy performance is often environment-dependent rather than parameter-dependent. Evaluating a strategy on a single symbol or timeframe can give a misleading sense of robustness. Testing across multiple environments provides a clearer view of where a strategy holds up and where it breaks down.
I’m documenting these tests to better understand robustness, sensitivity, and how commonly used TradingView strategies behave under different market conditions.
For this test, I ran a parameter sweep across multiple symbols and timeframes, keeping the strategy logic fixed while varying only RSI length and SMA length within reasonable ranges. The test covered BTCUSDT and ETHUSDT across 4H, 1D, 3D, and 1W timeframes, resulting in 160 total combinations.
The goal was not to find a single optimal configuration, but to observe whether performance is driven more by indicator parameters or by the trading environment itself.
Representative Results (Risk-Adjusted)
Below are four configurations that best illustrate the results and support the overall conclusions. These were selected for balance between profitability, drawdown, and trade frequency rather than headline return alone.
1) BTCUSDT — 1D (Most Stable Overall)
RSI Length: 28
SMA Length: 50
Profit Factor: ~1.77
Trades: ~109
This configuration showed the most consistent risk-adjusted behavior across nearby parameter sets and was less sensitive to small changes than others.
2) BTCUSDT — 1D (Lower Drawdown Variant)
RSI Length: 21
SMA Length: 50
Profit Factor: ~1.70
Trades: ~121
Slightly lower profitability than the first configuration, but meaningfully lower drawdown, highlighting a trade-off between responsiveness and stability.
3) ETHUSDT — 1D (Best ETH Environment)
RSI Length: 28
SMA Length: 40
Profit Factor: ~1.55–1.60
Trades: ~110–120
ETH showed acceptable performance on the daily timeframe, but drawdowns were consistently higher than BTC under similar settings.
4) BTCUSDT — 4H (Higher Activity, Lower Stability)
RSI Length: 28
SMA Length: 40
Profit Factor: ~1.55–1.60
Trades: 400+
Lower timeframes increased trade frequency substantially but introduced significantly more drawdown and instability.
Takeaway
Across all tests, performance varied far more by symbol and timeframe than by RSI or SMA length. Small parameter changes often mattered less than the environment the strategy was applied to. Some symbol/timeframe combinations remained relatively stable, while others deteriorated quickly despite using identical logic.
The broader takeaway is that strategy performance is often environment-dependent rather than parameter-dependent. Evaluating a strategy on a single symbol or timeframe can give a misleading sense of robustness. Testing across multiple environments provides a clearer view of where a strategy holds up and where it breaks down.
I’m documenting these tests to better understand robustness, sensitivity, and how commonly used TradingView strategies behave under different market conditions.

Strategy Builder • Explorer • Optimizer
Create strategies, explore thousands of TradingView ideas, & backtest at scale across symbols, timeframes, & parameters.
🌐 quanttradingpro.com
💬 Research & discussion: discord.gg/2systG9frc
Create strategies, explore thousands of TradingView ideas, & backtest at scale across symbols, timeframes, & parameters.
🌐 quanttradingpro.com
💬 Research & discussion: discord.gg/2systG9frc
Отказ от ответственности
Информация и публикации не предназначены для предоставления и не являются финансовыми, инвестиционными, торговыми или другими видами советов или рекомендаций, предоставленных или одобренных TradingView. Подробнее читайте в Условиях использования.
Strategy Builder • Explorer • Optimizer
Create strategies, explore thousands of TradingView ideas, & backtest at scale across symbols, timeframes, & parameters.
🌐 quanttradingpro.com
💬 Research & discussion: discord.gg/2systG9frc
Create strategies, explore thousands of TradingView ideas, & backtest at scale across symbols, timeframes, & parameters.
🌐 quanttradingpro.com
💬 Research & discussion: discord.gg/2systG9frc
Отказ от ответственности
Информация и публикации не предназначены для предоставления и не являются финансовыми, инвестиционными, торговыми или другими видами советов или рекомендаций, предоставленных или одобренных TradingView. Подробнее читайте в Условиях использования.