
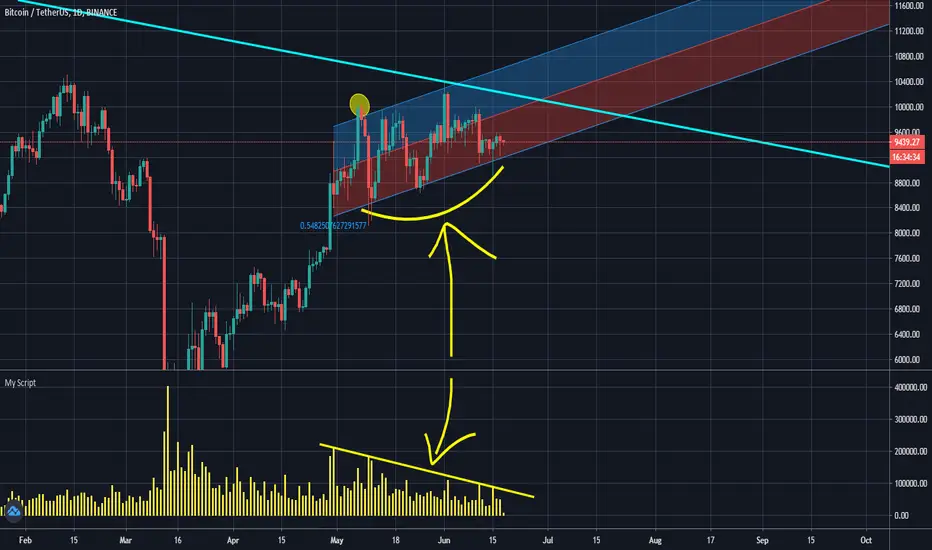
that blue line is the line that connects two important highs, the 20k and 14k. we had a rally from 3.8k to 10k then we are consolidating in an ascending channel it feels like 2019. when every correction in that time was a consolidation in an ascending manner actually volume is declining since we met 10k.
as i showed you on the chart above the yellow circle is the the end of an impulsive wave and now we are at a correction phase. we don't see volume and it's declining and market is lowering it's fluctuations.
my suggest is to long this market and here is a edge to start:
open a long position :
size : 50% of equity
EP = 9440 (now)
SL = 8800
TP = 10500
as i showed you on the chart above the yellow circle is the the end of an impulsive wave and now we are at a correction phase. we don't see volume and it's declining and market is lowering it's fluctuations.
my suggest is to long this market and here is a edge to start:
open a long position :
size : 50% of equity
EP = 9440 (now)
SL = 8800
TP = 10500
Заметка
just touched 61.8
Отказ от ответственности
Информация и публикации не предназначены для предоставления и не являются финансовыми, инвестиционными, торговыми или другими видами советов или рекомендаций, предоставленных или одобренных TradingView. Подробнее читайте в Условиях использования.
Отказ от ответственности
Информация и публикации не предназначены для предоставления и не являются финансовыми, инвестиционными, торговыми или другими видами советов или рекомендаций, предоставленных или одобренных TradingView. Подробнее читайте в Условиях использования.