
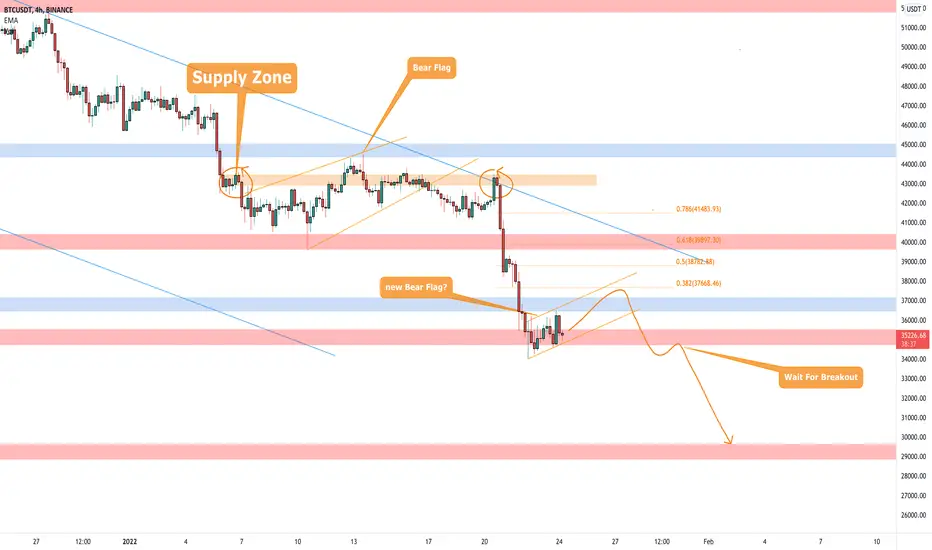
The price is creating another bear flag above the weekly support.
After the rejection from the supply zone, the price had a breakout from the weekly support, and not the market is testing the 35k weekly support below the daily resistance.
We could see a pullback until 0.382 - 0.5 Fibonacci level before a new leg down.
How to approach?
IF the price is going to have a breakout from the 35k and retest the previous support as new resistance we can look for a new short position applying our rules.
Be Aware of this support, because it's red support. it means that it's a weekly structure and you could see false breakouts.
Next valid support is 30k
–––––
Follow the Shrimp 🦐
Keep in mind.
After the rejection from the supply zone, the price had a breakout from the weekly support, and not the market is testing the 35k weekly support below the daily resistance.
We could see a pullback until 0.382 - 0.5 Fibonacci level before a new leg down.
How to approach?
IF the price is going to have a breakout from the 35k and retest the previous support as new resistance we can look for a new short position applying our rules.
Be Aware of this support, because it's red support. it means that it's a weekly structure and you could see false breakouts.
Next valid support is 30k
–––––
Follow the Shrimp 🦐
Keep in mind.
- 🟣 Purple structure -> Monthly structure.
- 🔴 Red structure -> Weekly structure.
- 🔵 Blue structure -> Daily structure.
- 🟡 Yellow structure -> 4h structure.
Заметка
the price had a breakout from the bear flag and now the market is trying to keep the weekly support.
No short position triggered so far, as you know a breakout is not enough!
Заметка
Be Careful with Bitcoin, the price had a false breakout from the bear flag and now it's testing the 0.382 Fibonacci level as I said in my previous analysis.
We didn't open any short position after a breakout because the price didn't trigger our rules.
On the upper chart, you can see how the SPX500 is testing the daily support after a pin bar with a retest of 0.382 Fibonacci level. We could see a "Fill the wick", the price could fill the wick of the green candle.
In that case, Bitcoin (the lower chart) is going to follow it and we could see a new leg down.
How to approach?
We need to see a clear breakdown of 35k to open a new short position according to our rules.
Be careful on 0.618 Fibonacci level where you can find a supply zone.
Заметка
Nice reaction from the 36k weekly support.
Now the price is going to test the 0.5 Fibonacci level, if you look on the left you can see a green candle between red candles, it means that we could see a rejection from that area.
Bullish above 40k
Заметка
Bitcoin had volatility due to FOMC and got a rejection from the supply zone (0.5 Fibonacci level )as I said in preview analysis.The price is still above the weekly support, and if the market is going to confirm this support we could see a new higher low.
How to approach?
The Price is between the range 39k-35k. If the price is going to have a breakdown from the weekly support, we could see a new bearish impulse until 30k.
Bullish above 40k
Заметка
The price got a rejection from the supply zone (Fibonacci 0.5) and the market is creating a new bear flag above the weekly support.
We are waiting for a new breakdown of weekly support to apply our rules for a new short position
Заметка
The market is testing the supply all day long.That area is very strong, we need to see a clear breakout with volume.
Bullish above the 40k
Заметка
The price got a rejection from the descending channel and supply zone.As I told during these days, bullish above the 40k
Wait for the Daily close

Похожие публикации
Отказ от ответственности
Информация и публикации не предназначены для предоставления и не являются финансовыми, инвестиционными, торговыми или другими видами советов или рекомендаций, предоставленных или одобренных TradingView. Подробнее читайте в Условиях использования.
Похожие публикации
Отказ от ответственности
Информация и публикации не предназначены для предоставления и не являются финансовыми, инвестиционными, торговыми или другими видами советов или рекомендаций, предоставленных или одобренных TradingView. Подробнее читайте в Условиях использования.