
Hello everyone,
Let's take a look at the BTC to USDT 1 day chart.
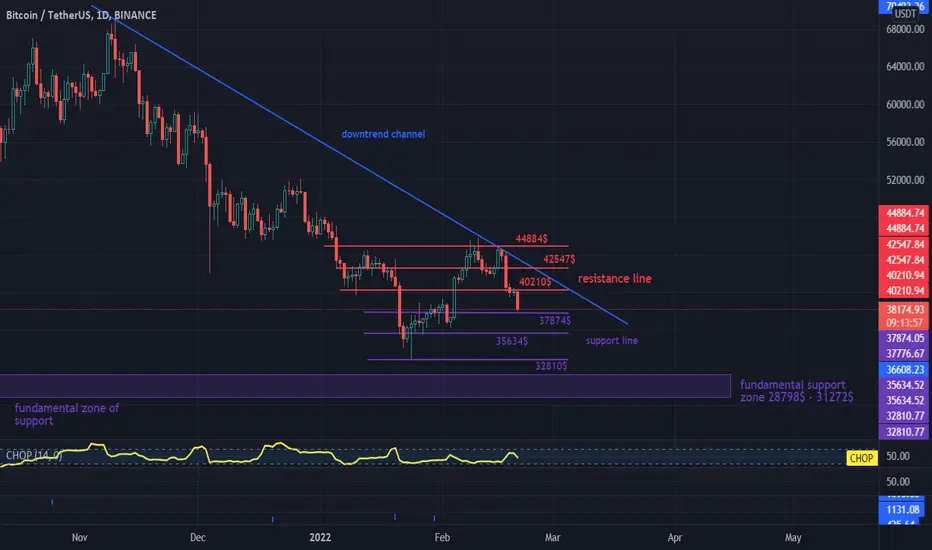
Let's start by determining the downtrend line at which the price is currently moving.
Currently, the price is just above the support at $ 37,874 if we do not defend this level, the next support is at $ 35,634 and $ 32,810, the next support is the fundamental support zone between $ 31,272 and $ 28,798.
However, if the correction is complete, we can determine the first resistance at $ 40,210 and the next resistance at $ 42,547 and $ 44,884.
The CHOP indicator also shows a decrease in energy, but it has not been completely exhausted.

Отказ от ответственности
Информация и публикации не предназначены для предоставления и не являются финансовыми, инвестиционными, торговыми или другими видами советов или рекомендаций, предоставленных или одобренных TradingView. Подробнее читайте в Условиях использования.
Отказ от ответственности
Информация и публикации не предназначены для предоставления и не являются финансовыми, инвестиционными, торговыми или другими видами советов или рекомендаций, предоставленных или одобренных TradingView. Подробнее читайте в Условиях использования.