
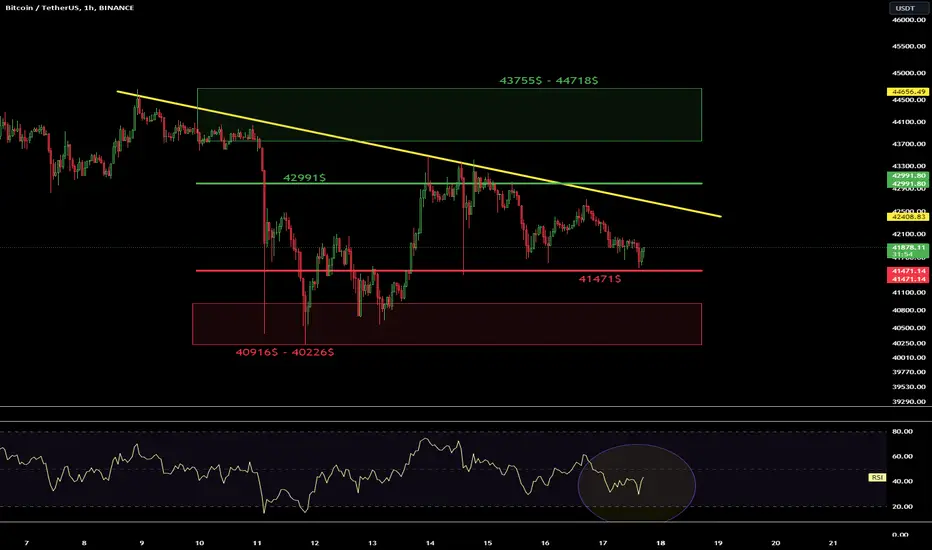
Hello everyone, let's take a look at the BTC to USDT chart, on a one-hour time frame. As you can see, the price is moving below the local downtrend line.
When we unfold the Fib Retracement grid, we will see support at the level of $41,471, and then it is worth defining a strong support zone from $40,916 to $40,226.
Looking the other way, there is resistance at $42,991, and then we have a very strong resistance zone from $43,755 to $44,718.
It is worth paying attention to the RSI indicator, which shows a rebound, as well as room for the price to go lower.

Отказ от ответственности
Информация и публикации не предназначены для предоставления и не являются финансовыми, инвестиционными, торговыми или другими видами советов или рекомендаций, предоставленных или одобренных TradingView. Подробнее читайте в Условиях использования.
Отказ от ответственности
Информация и публикации не предназначены для предоставления и не являются финансовыми, инвестиционными, торговыми или другими видами советов или рекомендаций, предоставленных или одобренных TradingView. Подробнее читайте в Условиях использования.