
Hello,
Welcome to this analysis about BITCOIN and the 4-hour timeframe perspectives. Bitcoin in recent times so far managed to hold above the $36,000 level and managed to build up above this range. Also, the Bitcoin Dominance actually reached a 2-months high which is an important indication that Bitcoin actually gains in strength against the Altcoins. Besides that, the institutional interest increases further, and institutions such as MicroStrategy buy into the dips. There is given evidence that Bitcoin so far has abilities to hold in the structure and potentially build up further on it nevertheless the technicals need to move simultaneously with this indication, therefore, I detected all the important levels, structural formations, and upcoming determinations to consider.
Structural Developments:
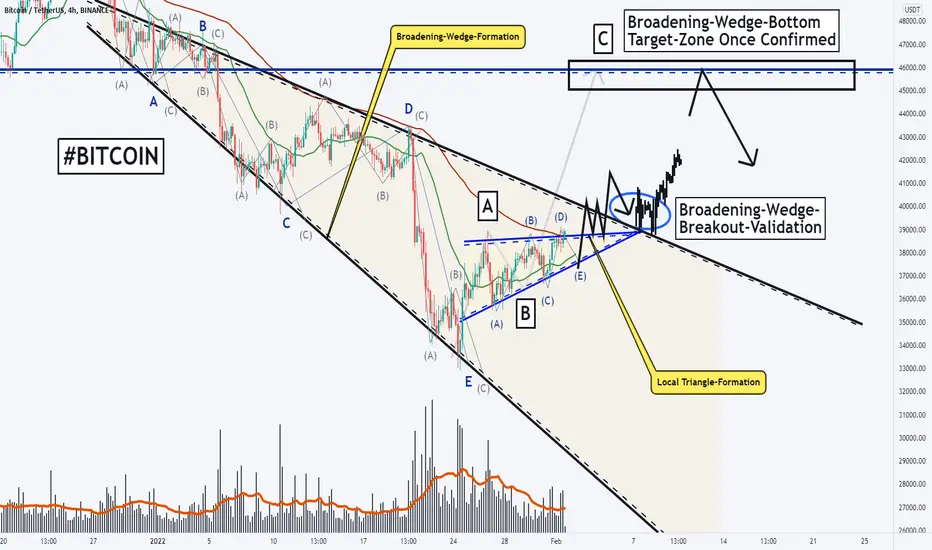
As when looking at my chart we can watch there how BITCOIN has formed this massive broadening-wedge-bottoming-formation in which it actually showed up with a wave-count reaching from A to E, this wave-count has been already completed with the finalization of the wave E within the lower boundary from where Bitcoin moved on to bounce and form this local triangle-formation that is marked in my chart in blue, in this triangle formation Bitcoin also has a coherent wave-count that already completed. Now with Bitcoin bouncing within the 25-EMA marked in green, there is a good structure on which Bitcoin can build on and finally form the breakout above the upper boundary of the ascending triangle formation which will be the initial confirmation of a final validation and completion of the broadening wedge.
Upcoming Determinations:
Taking all these factors into consideration Bitcoin is in a structure that forms the final breakouts and emerges above the upper boundary of the descending wedge as it is marked in my chart, such a breakout will activate the further continuations and Bitcoin is going to approach the $46,000 level as marked in my chart in the blue horizontal zone. Once Bitcoin reached out there this does not mean Bitcoin is completely bullish because when this dynamic emerges it will be important on what for a formation develops from there on, if Bitcoin pulls back heavily from the structure and firstly visits lower levels this will not be a good indication however when Bitcoin manages to stay in this area and form something like a continuation formation this will lead to possible further highs in the structure, it will be an interesting development ahead.
In this manner, thank you for watching the analysis, all the best!
"Great fortune is when opportunity meets preparation."
Information provided is only educational and should not be used to take action in the markets.
Welcome to this analysis about BITCOIN and the 4-hour timeframe perspectives. Bitcoin in recent times so far managed to hold above the $36,000 level and managed to build up above this range. Also, the Bitcoin Dominance actually reached a 2-months high which is an important indication that Bitcoin actually gains in strength against the Altcoins. Besides that, the institutional interest increases further, and institutions such as MicroStrategy buy into the dips. There is given evidence that Bitcoin so far has abilities to hold in the structure and potentially build up further on it nevertheless the technicals need to move simultaneously with this indication, therefore, I detected all the important levels, structural formations, and upcoming determinations to consider.
Structural Developments:
As when looking at my chart we can watch there how BITCOIN has formed this massive broadening-wedge-bottoming-formation in which it actually showed up with a wave-count reaching from A to E, this wave-count has been already completed with the finalization of the wave E within the lower boundary from where Bitcoin moved on to bounce and form this local triangle-formation that is marked in my chart in blue, in this triangle formation Bitcoin also has a coherent wave-count that already completed. Now with Bitcoin bouncing within the 25-EMA marked in green, there is a good structure on which Bitcoin can build on and finally form the breakout above the upper boundary of the ascending triangle formation which will be the initial confirmation of a final validation and completion of the broadening wedge.
Upcoming Determinations:
Taking all these factors into consideration Bitcoin is in a structure that forms the final breakouts and emerges above the upper boundary of the descending wedge as it is marked in my chart, such a breakout will activate the further continuations and Bitcoin is going to approach the $46,000 level as marked in my chart in the blue horizontal zone. Once Bitcoin reached out there this does not mean Bitcoin is completely bullish because when this dynamic emerges it will be important on what for a formation develops from there on, if Bitcoin pulls back heavily from the structure and firstly visits lower levels this will not be a good indication however when Bitcoin manages to stay in this area and form something like a continuation formation this will lead to possible further highs in the structure, it will be an interesting development ahead.
In this manner, thank you for watching the analysis, all the best!
"Great fortune is when opportunity meets preparation."
Information provided is only educational and should not be used to take action in the markets.

►✅JOIN THE BEST+ TOP TELEGRAM TRADING CHANNEL: t.me/VincePrinceForexGoldStocks
►🚀Join Premium Channels: bit.ly/4bUD8N8
►🔥JOIN BYBIT TOP EXCHANGE►🎁 UP TO $30,000 BONUS NOW: partner.bybit.com/b/VinceByBit
►🚀Join Premium Channels: bit.ly/4bUD8N8
►🔥JOIN BYBIT TOP EXCHANGE►🎁 UP TO $30,000 BONUS NOW: partner.bybit.com/b/VinceByBit
Отказ от ответственности
Информация и публикации не предназначены для предоставления и не являются финансовыми, инвестиционными, торговыми или другими видами советов или рекомендаций, предоставленных или одобренных TradingView. Подробнее читайте в Условиях использования.
►✅JOIN THE BEST+ TOP TELEGRAM TRADING CHANNEL: t.me/VincePrinceForexGoldStocks
►🚀Join Premium Channels: bit.ly/4bUD8N8
►🔥JOIN BYBIT TOP EXCHANGE►🎁 UP TO $30,000 BONUS NOW: partner.bybit.com/b/VinceByBit
►🚀Join Premium Channels: bit.ly/4bUD8N8
►🔥JOIN BYBIT TOP EXCHANGE►🎁 UP TO $30,000 BONUS NOW: partner.bybit.com/b/VinceByBit
Отказ от ответственности
Информация и публикации не предназначены для предоставления и не являются финансовыми, инвестиционными, торговыми или другими видами советов или рекомендаций, предоставленных или одобренных TradingView. Подробнее читайте в Условиях использования.