
Hello?
Welcome, traders.
By "following", you can always get new information quickly.
Please also click "Boost".
Have a good day.
-------------------------------------
(BTCUSDT 1W Chart)

The key is whether it can rise above 19695.87.
If not, it is expected to lead to further declines.
When the RSI indicator moves out of the oversold zone, it is necessary to check where support and resistance are found.
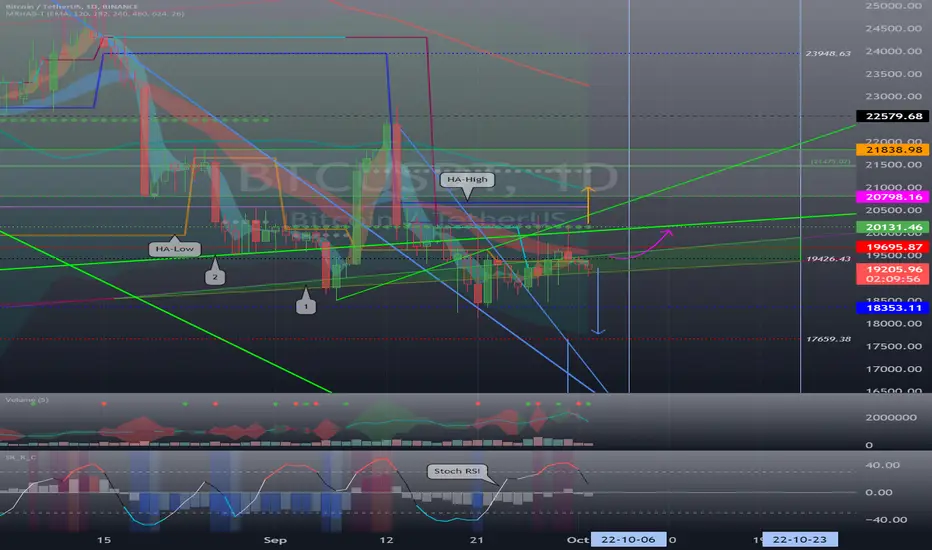
(1D chart)
Above the rising channel (1), we need to see if we can rise above 19426.43.
If not, it is expected to decline to the 17659.38-18353.11 section.
If the price holds above 19426.43 in the volatility around October 6th, it is expected to lead to further gains.
At this time, the key is whether it can rise above the uptrend line (2) and above 20131.46.
------------------------------
- big picture
I think you need to be supported in the 13K-15K section to gain the strength to rise.
So, whether it rises or falls from its current position, both require a short-term response.
A full-fledged uptrend is expected to begin when it rises above 29K.
------------------------------------------------------------ -------------------------------------------
** All descriptions are for reference only and do not guarantee a profit or loss in investment.
** If you share this chart, you can use the indicators normally.
** The MRHAB-T indicator contains indicators that indicate support and resistance points.
** SR_R_C indicators are displayed as StochRSI(line), RSI(columns), CCI(bgcolor).
** CCI indicator is expressed as overbought range (CCI > +100) and oversold range (CCI < -100).
(Short-term Stop Loss can be said to be a point where profit and loss can be preserved or additional entry can be made through split trading. It is a short-term investment perspective.)
---------------------------------
Welcome, traders.
By "following", you can always get new information quickly.
Please also click "Boost".
Have a good day.
-------------------------------------
(BTCUSDT 1W Chart)
The key is whether it can rise above 19695.87.
If not, it is expected to lead to further declines.
When the RSI indicator moves out of the oversold zone, it is necessary to check where support and resistance are found.
(1D chart)
Above the rising channel (1), we need to see if we can rise above 19426.43.
If not, it is expected to decline to the 17659.38-18353.11 section.
If the price holds above 19426.43 in the volatility around October 6th, it is expected to lead to further gains.
At this time, the key is whether it can rise above the uptrend line (2) and above 20131.46.
------------------------------
- big picture
I think you need to be supported in the 13K-15K section to gain the strength to rise.
So, whether it rises or falls from its current position, both require a short-term response.
A full-fledged uptrend is expected to begin when it rises above 29K.
------------------------------------------------------------ -------------------------------------------
** All descriptions are for reference only and do not guarantee a profit or loss in investment.
** If you share this chart, you can use the indicators normally.
** The MRHAB-T indicator contains indicators that indicate support and resistance points.
** SR_R_C indicators are displayed as StochRSI(line), RSI(columns), CCI(bgcolor).
** CCI indicator is expressed as overbought range (CCI > +100) and oversold range (CCI < -100).
(Short-term Stop Loss can be said to be a point where profit and loss can be preserved or additional entry can be made through split trading. It is a short-term investment perspective.)
---------------------------------
Заметка
(NASDAQ100 1D Chart)The long-term downtrend line (1), near 10666.6, is the key to touch and move higher.
Заметка
(USDC 1D Chart)For the first time since September 25, funds are expected to flow into the coin market.
Although the inflow rate is small, the key is whether funds will continue to flow into the coin market in the future.

[Practical trading strategy using HA-MS and SBOD]
youtu.be/aceN1AttX1Y
[Renko Bot]
readcrypto.kr/live
youtu.be/aceN1AttX1Y
[Renko Bot]
readcrypto.kr/live
Похожие публикации
Отказ от ответственности
Информация и публикации не предназначены для предоставления и не являются финансовыми, инвестиционными, торговыми или другими видами советов или рекомендаций, предоставленных или одобренных TradingView. Подробнее читайте в Условиях использования.