
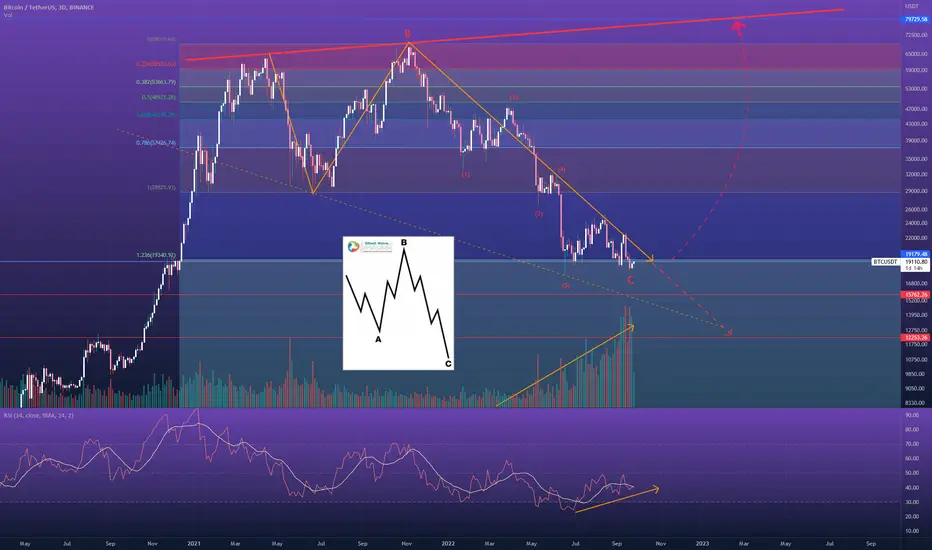
Bear with me (pun intended). I know I'll probably get some slack from the 5 wave correction counting of wave C. Most people would place the 3rd wave in June instead of May, but a few things suggest me that the 3rd wave down was actually in May:
All of the above considered, there's still something missing: that the C wave should hold RSI divergence between wave 3 and 5 at completion, which did not happen with this counting. Also BTC would not only have be above the 19.3k resistance of the 123.6% extension of wave A (which is being rejected @ the moment) as it would also need to break & retest that yellow trendline (hands tied with the faster EMA's) that is holding its price down. But where is the fun in posting ideas when all of the cards are on the table? =D
All I'm saying is that this correction is closer to its ending than the other way around, and what I'm suggesting is that I wouldn't be surprised if it would be already over.
DYOR. Not advice
[* ]This C wave lies at the 123.6% extension of wave A which is a common area for the Expanded Flat correction.- Volume and RSI printing a divergence
- 2M RSI just broke out of its falling wedge
- BTCUSDT resiliance at the 19k level, in contrast with the current equity price action & general sentiment, which goes against the previous sell offs of April and June
All of the above considered, there's still something missing: that the C wave should hold RSI divergence between wave 3 and 5 at completion, which did not happen with this counting. Also BTC would not only have be above the 19.3k resistance of the 123.6% extension of wave A (which is being rejected @ the moment) as it would also need to break & retest that yellow trendline (hands tied with the faster EMA's) that is holding its price down. But where is the fun in posting ideas when all of the cards are on the table? =D
All I'm saying is that this correction is closer to its ending than the other way around, and what I'm suggesting is that I wouldn't be surprised if it would be already over.
DYOR. Not advice
Заметка
Squeeze momentum and Derivative oscillator printing a bullish divergence on the 3D timeframeЗаметка
2M RSI holding 47 tightly for the last 6 months. Historically speaking, that's pretty strong.It's also worth noting that you have to go back 4 years to see a Stochastic this much oversold and it surely looks like it's about to cross its MA which is very bullish
Not to mention the inverted hammer on July-August.
The case for a bottom keeps getting stronger and stronger
Заметка
15 weeks later and price is still holding the bottom of the 1 extension channel. Заметка
PPO printed several Bullish divergence alerts for the first time in the 1W timeframe. See similarities with previous bottoms (marked with a circle)?
BTC might go below 18k, but ignore the noise, we're looking at a very bullish chart
Заметка
Same PPO printing a bearish divergence on the DollarЗаметка
BTC market cap is already losing momentum. And Alt Market Cap on the fly
Alt season is ON! Good luck!
Заметка
Yes FTX happened, yes that was unexpected (at least for me, since I mostly do TA), but no, it wasn't the final blow. BTC was breaking out of its fallen wedge like we expected, and to prove that wasn't a false breakout is now doing just that, once again. A retest on the trend line would confirm it, but check this out:BTC Dominance in 1W timeframe is squeezing, S-RSI is looking like it will go under 50, and the RSI trapped inside the channel, not being able to break the MA.
USDT Dominance also looking like it's topping and Alt Market Cap back on the breakout. My stance from the 21st of October stands: ignore the noise, we're looking at a bullish scenario in the medium to long term.
Заметка
I think this is it. One more evidence that the FTX shambles simply delayed what was bound to happen:*** A break on the 3W RSI signal line is tremendous ***
Заметка
Beautiful formation on the 3D Alt Market Cap. It also broke the last of the descending trend lines. This must be it!Заметка
SP500 just solidly broke two major resistances!Заметка
Bond yields bound to fall. Enjoy the ride fokesЗаметка
Bond Yields: MACD just crossed its signal on the 3W chart. 1.9% target still stands (on other news, DXY printed a Head & Shoulders)
Заметка
VIX just broke down major trendline! This is going to be a big SPX & Crypto rallyЗаметка
On top of everything that was already said:USDT dominance brokedown the trendline and it's now being rejected by both 25 and 50 MA
It's true that the BTC Dominance dind't behave as I expected but I don't think that affects the Alt market as it did until now. I think institutional money will start to pour on BTC to the point that it will increase its dominance overall while large breadcrumbs will spill through retail capital on the alt market. It's just a game of proportions. The alt market will still benefit tremoundsly from this while BTC keeps its crown.
I wondered a couple months back if ETH would be able to lead a coup d'etat, but that seems to be every day less likely.
Заметка
Looking good!Breakout of channel, let's see if with a successful retest of the upper bound. If so, by breaking the 41k resitance, then Bitcoin will set up a massive upside potential to god knows where.
Заметка
USDT.DWhat was once support is now resistance. Bottom of the major ascending channel is where it goes. Reaching that target confirms my July 6th prediction.
Заметка
Still doubting? RSI trendline from May of 2021 is now broken.
2nd corrective wave of USDT.D is coming. 5.67% resistance being rejected.
Everything keeps unfolding according to plan
Заметка
As sweet as it gets. First real targets of 80k and 100k are surely going to be reached.
I'll see you on the other side :)
Заметка
Rising wedge on the BTC dominance chart. Alt season incomingЗаметка
BTC with a clear cup & handle formation! This means a projected 120k target, let's go!Заметка
USDT.D support of the bearish flag turned into resistance! If it continues to play like this, it's a matter of days until the bullish major trend is reinstated:BTD.D has now a MACD bearish divergence both on the D and W timeframes, while the rising wedge pattern still stands.
We keep on going!
Сделка активна
USDT.D lost support and is on a downhill since Oct. 2024. If you also made that bet, cheers!But that still hasn't translated to many ALTs
The FED can't keep this any longer. Powell is losing the political battle with Trump and the chart has been clear for many months: interest rates must go down to at least 2% and possibly sooner that many would expect.
When (not if) that happens, cheaper money can be the final and ultimate impulse for the rest of ALTs to explode, the impulse that we've been waiting for so patiently. Only this time, the optimism is unprecedented:
"American families could receive thousands of dollars from the Trump administration under a new bill introduced by Senator Josh Hawley" - Newsweek
This is the current administration trying to politically capitalize on the tariffs. And remember what happened last time Trump gave out checks? It was during COVID, and yeah, markets' meltups, inflation... That's what people with "free" money do and that can lead us for sure to new ATHs beyond any expectations in this market, in a very short span of time, followed by a steep correction afterwards.
BTC.D is already facing a massive resistance @ 61% ¡going in on a lower high for the first time since 2021 and that means going under the current ascending channel!
I hope you have been making smart longs over the course of the last few months, because we're closer than ever to a major meltup.
See you on the other side.
Сделка закрыта: достигнута тейк-профит цена
"Fed's powell'jackson hole: in footnote, notes that next bls benchmark revision to jobs data should see level 'revised down materially"Trump got what he wanted. The FED just opened up the can for rate cuts. New ATH for many indexes, stocks, cryptos... if there were still doubts on the bullrun.
I'm going to close this thread and open a new one when my assessments indicate the ending of this upwards momentum.

Отказ от ответственности
Информация и публикации не предназначены для предоставления и не являются финансовыми, инвестиционными, торговыми или другими видами советов или рекомендаций, предоставленных или одобренных TradingView. Подробнее читайте в Условиях использования.
Отказ от ответственности
Информация и публикации не предназначены для предоставления и не являются финансовыми, инвестиционными, торговыми или другими видами советов или рекомендаций, предоставленных или одобренных TradingView. Подробнее читайте в Условиях использования.