
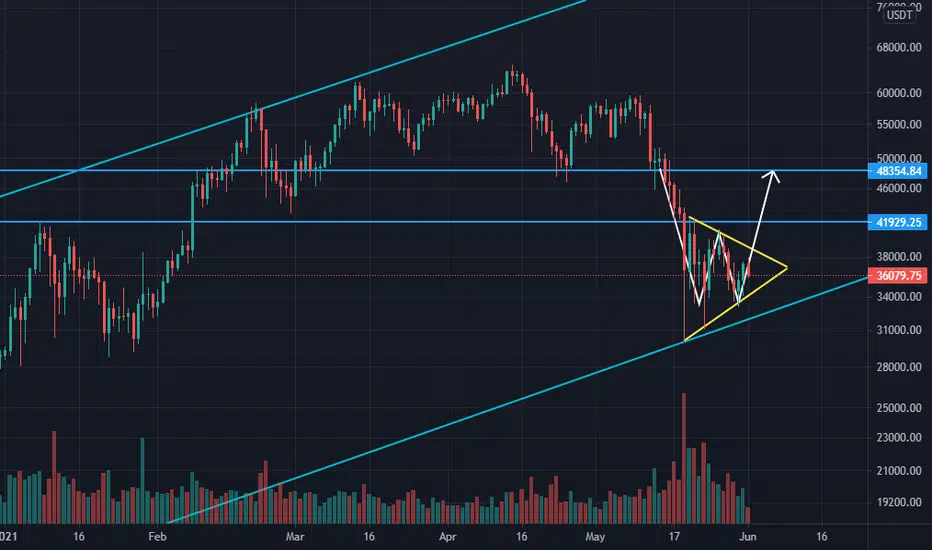
A double bottom is happening on BTCUSDT chart, It is not completed yet
Also we can see a triangle, If price breaks through the top line of the triangle then we can see also that double bottom pattern is working.
When BTC wants to break some price level, it breaks it in fast movement
You can see the targets on chart
Also:
- A double bottom is happening in Total Market Cap
- A double Top is happening in USDT Dominance
None of them are completed yet but I think it will.
" I can see a big head and shoulders too but I think it does not happen, Not now with the fact we have, Not if the supports are not lost. "
Also we can see a triangle, If price breaks through the top line of the triangle then we can see also that double bottom pattern is working.
When BTC wants to break some price level, it breaks it in fast movement
You can see the targets on chart
Also:
- A double bottom is happening in Total Market Cap
- A double Top is happening in USDT Dominance
None of them are completed yet but I think it will.
" I can see a big head and shoulders too but I think it does not happen, Not now with the fact we have, Not if the supports are not lost. "
Заметка
A double bottom is happening on ETHUSDT, We can see bullish signals in whole marketЗаметка
Price breaks through the bottom line of the triangle, A double Top happened and it broke its neck line
Похожие публикации
Отказ от ответственности
Информация и публикации не предназначены для предоставления и не являются финансовыми, инвестиционными, торговыми или другими видами советов или рекомендаций, предоставленных или одобренных TradingView. Подробнее читайте в Условиях использования.
Похожие публикации
Отказ от ответственности
Информация и публикации не предназначены для предоставления и не являются финансовыми, инвестиционными, торговыми или другими видами советов или рекомендаций, предоставленных или одобренных TradingView. Подробнее читайте в Условиях использования.