
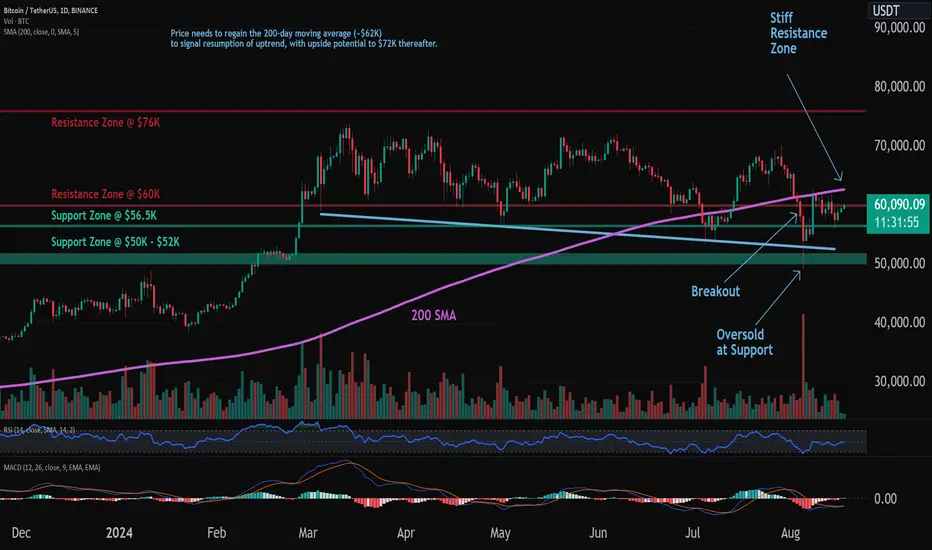
Trade setup: Break below 200-day MA (~$61.5K) threatens the uptrend and price has made a Lower Low during the current downswing, which is also a negative sign. Price has bounced off from oversold levels (RSI < 30) and reached a stiff resistance zone of $60K - $62K (200-day MA). Price needs to regain the 200-day moving average (~$62K) to signal resumption of uptrend, with upside potential to $72K thereafter.
Pattern: Price is Approaching Resistance, which is a level where it could pause or reverse its recent advance, at least temporarily. Resistance is often a level where price got rejected in the past, or potentially prior Support level that was broken. (concept known as polarity). Once price breaks above resistance, it can advance higher to the next resistance level. Learn to trade key levels in Lesson 7.
Trend: Short-term trend is Strong Down, Medium-term trend is Strong Down and Long-term trend is Down.
Momentum: Price is neither overbought nor oversold currently, based on RSI-14 levels (RSI > 30 and RSI < 70).
Support and Resistance: Nearest Support Zone is $56.50, then $50.00.
Pattern: Price is Approaching Resistance, which is a level where it could pause or reverse its recent advance, at least temporarily. Resistance is often a level where price got rejected in the past, or potentially prior Support level that was broken. (concept known as polarity). Once price breaks above resistance, it can advance higher to the next resistance level. Learn to trade key levels in Lesson 7.
Trend: Short-term trend is Strong Down, Medium-term trend is Strong Down and Long-term trend is Down.
Momentum: Price is neither overbought nor oversold currently, based on RSI-14 levels (RSI > 30 and RSI < 70).
Support and Resistance: Nearest Support Zone is $56.50, then $50.00.

Отказ от ответственности
Информация и публикации не предназначены для предоставления и не являются финансовыми, инвестиционными, торговыми или другими видами советов или рекомендаций, предоставленных или одобренных TradingView. Подробнее читайте в Условиях использования.
Отказ от ответственности
Информация и публикации не предназначены для предоставления и не являются финансовыми, инвестиционными, торговыми или другими видами советов или рекомендаций, предоставленных или одобренных TradingView. Подробнее читайте в Условиях использования.