
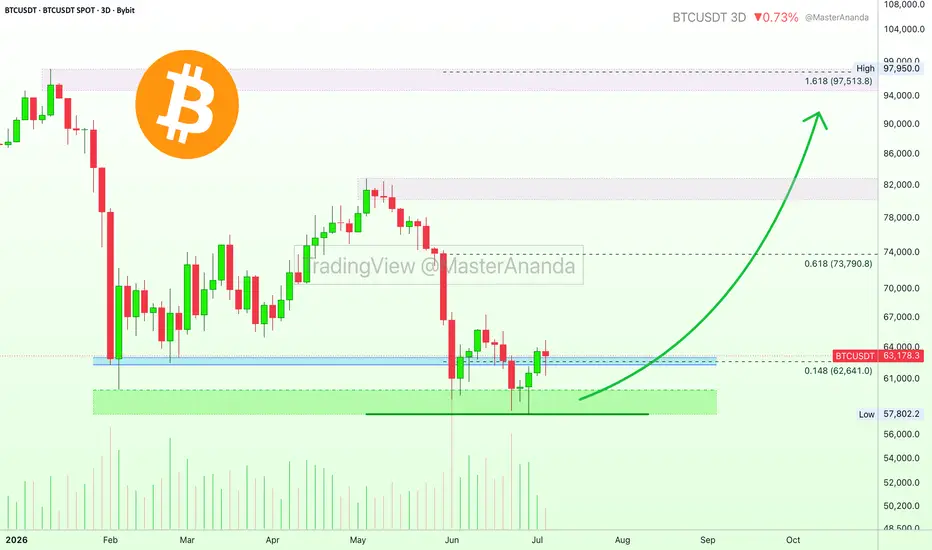
I am using three days candles on this chart and we have some mixed signals. Bitcoin started to recover after the 24-June low with a double-bottom 30-June and now we have a sequence of three sessions closing green, a total of nine days.
It is interesting to see Bitcoin trading above the 3-Feb low around $62,286, a level that is marked blue on this chart. Notice how the current session moved below it just to recover. Above this level things are good but the market can change as the chart is a bit mixed.
This same level worked as support 24-February and the 6-Feb crash low, while the wicked reached $60,000, ended up closing above. The 0.148 Fib. extension level has been conquered as resistance last session, and this is another minor signal in favor of the bulls.
When we consider the weekly chart, the same support range has been active for more than five months and continues to hold. See how perfectly Bitcoin found support at the 0.618 Fib. retracement level in relation to the Nov 2022-Oct 2025 bullish cycle, this is a very strong signal: The black line on the chart stands for MA200 and Bitcoin has been hovering around this level for six weeks now. Just one week it closed below just to recover. We are seeing the establishment of a support base. Last week turning full green at these levels favors the bulls big time with the low from early June also being recovered.
Needless to say, BTCUSDT can be considered extremely bullish and a strong buy while it trades above $60,000 on the weekly timeframe.
Thank you for reading.
Namaste.
It is interesting to see Bitcoin trading above the 3-Feb low around $62,286, a level that is marked blue on this chart. Notice how the current session moved below it just to recover. Above this level things are good but the market can change as the chart is a bit mixed.
This same level worked as support 24-February and the 6-Feb crash low, while the wicked reached $60,000, ended up closing above. The 0.148 Fib. extension level has been conquered as resistance last session, and this is another minor signal in favor of the bulls.
When we consider the weekly chart, the same support range has been active for more than five months and continues to hold. See how perfectly Bitcoin found support at the 0.618 Fib. retracement level in relation to the Nov 2022-Oct 2025 bullish cycle, this is a very strong signal:
Needless to say, BTCUSDT can be considered extremely bullish and a strong buy while it trades above $60,000 on the weekly timeframe.
Thank you for reading.
Namaste.

💯 TOP Results (Sept 2026) 👇
t.me/masteranandatrades/9279
🔥 10-25X Leverage, Results & Profits
t.me/masteranandatrades/9271
✅ 4 PREMIUM Telegram channels special offer
—One-Time Payment! (🔝 since 2017)
t.me/lamatrades/4
t.me/masteranandatrades/9279
🔥 10-25X Leverage, Results & Profits
t.me/masteranandatrades/9271
✅ 4 PREMIUM Telegram channels special offer
—One-Time Payment! (🔝 since 2017)
t.me/lamatrades/4
Похожие публикации
Отказ от ответственности
Информация и публикации не предназначены для предоставления и не являются финансовыми, инвестиционными, торговыми или другими видами советов или рекомендаций, предоставленных или одобренных TradingView. Подробнее читайте в Условиях использования.
💯 TOP Results (Sept 2026) 👇
t.me/masteranandatrades/9279
🔥 10-25X Leverage, Results & Profits
t.me/masteranandatrades/9271
✅ 4 PREMIUM Telegram channels special offer
—One-Time Payment! (🔝 since 2017)
t.me/lamatrades/4
t.me/masteranandatrades/9279
🔥 10-25X Leverage, Results & Profits
t.me/masteranandatrades/9271
✅ 4 PREMIUM Telegram channels special offer
—One-Time Payment! (🔝 since 2017)
t.me/lamatrades/4
Похожие публикации
Отказ от ответственности
Информация и публикации не предназначены для предоставления и не являются финансовыми, инвестиционными, торговыми или другими видами советов или рекомендаций, предоставленных или одобренных TradingView. Подробнее читайте в Условиях использования.