
Hello.
Nice to meet you, fellow traders.
If you "follow" me, you can always get new information quickly.
Have a great day today.
------------------------------------
You must proceed with trading according to your trading strategy by identifying volatility zones or support and resistance points on the chart.
To do this, we use various methods that suit our own criteria.
In that sense, you can use indicators such as the Price Channel or Bollinger Bands.
I use the Price Channel indicator because when the indicator shows a horizontal line, it can be utilized as a support and resistance point.
The fact that the Price Channel line itself is not being generated indicates that it is in a volatility period.
Therefore, since the LL line of the Price Channel indicator is currently not being generated, we can see that the low point is in a volatility period.
Therefore, if the Price Channel indicator forms a diagonal line one day, whether support is found near the endpoint becomes a critical factor.
In this way, indicators provide the information you need, allowing you to save time in interpreting charts.
------------------------------------
Since this year can be considered a bear market, I believe that a significant volume of trading is required for a bullish reversal.
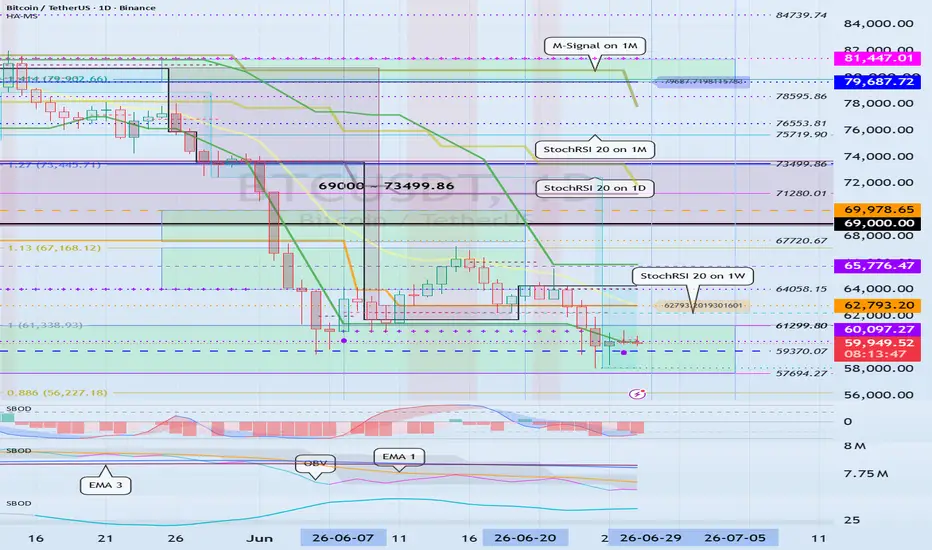
However, considering existing support and resistance points, the current price level—around 57,694.27 to 61,299.80—can be seen as a critical zone.
This is because it corresponds to the previous high point range.
If the price falls below this level, support must be confirmed around 48,189.84.
Therefore, when falling to around 48,189.84, you must verify whether it shows signs of being supported while generating a large volume of trading.
If the price turns upward without being accompanied by significant trading volume, it is likely to end in a rebound, and the rebound zone is expected to be around points 1 and 2.
Therefore, you must check the movement when the Price Channel indicator's LL line is formed, as it shows signs of support.
-
Although the chart displays a chaotic array of lines, as mentioned earlier, you should first check for support around the 57694.27 ~ 61299.80 range.
If the price falls from the 57694.27 ~ 61299.80 range, as previously mentioned, you must consider a response strategy while monitoring trading volume movements as it approaches the 48189.84 point.
However, since it has encountered the HA-Low indicator, you must formulate a buy strategy to respond.
The formation of the HA-Low indicator signifies that a bottom zone has been established; therefore, even if the downtrend continues, it will eventually reverse into an uptrend following a stepwise decline.
If the price rises from the 57,694.27 ~ 61,299.80 range, looking at the big picture:
1st: 62,793.20
2nd: 69,000 ~ 73,499.86
3rd: 79,687.72 ~ 81,447.01
You must check for support around the 1st to 3rd levels mentioned above.
If the price rises and maintains a sideways movement above the M-Signal indicator on the 1M chart, it will play a crucial role in monitoring the subsequent trend, as there is a possibility that it will eventually transition to an uptrend.
Since the LL line of the Price Channel indicator on the 1D chart has formed, you must carefully observe for support around 60,097.27. You must verify whether the OBV indicator rises above EMA 1 and maintains that level, and whether it can rise above the High Line.
If it fails to do so, it will likely only feign an upward trend before showing signs of a decline.
This period of volatility is expected to continue until June 30th.
-
Thank you for reading to the end.
I wish you successful trading.
-------------------------------------------------
Сделка активна
#BTCUSDTAs the price shows a sideways trend around 60097.27, the HA-Low indicator appears to be created at the 60402.99 point.
Accordingly, the key is whether the HA-Low indicator can be supported and rise when it is created at the 60402.99 point.
As the next volatility period passes around July 5th (July 4th to 6th), you should check which zone you are located in around the circle marked on the chart.
In order for the price to continue its upward trend, it must break upward through the 69000 to 73499.86 range and maintain the price.
Заметка
I believe that a gap down in USDT or USDC is a sign of capital outflow from the coin market.
Therefore, I believe that for the coin market to show an uptrend, USDT or USDC must show a gap up.
Заметка
When conducting trades, the important factors are the investment period, investment weight, and buying point (trading method).
1. Investment Period
You must consider and decide which asset or coin (token) you will invest in and for what period.
This must be done in advance before you start trading.
This is because the subsequent investment weight and buying point (trading method) will vary depending on your investment period—that is, whether it is day trading, short-term, medium-term, or long-term.
To do this, we search for and verify issues or corporate value regarding the asset or coin (token) we intend to trade.
At this stage, caution is required, as failing to consider chart movements may lead to being trapped in your own subjective thoughts.
2. Investment Weight
Once you have selected the asset or coin (token) to trade and determined the investment period, you must adjust your investment weight accordingly.
The longer the investment, the lower the investment weight should be.
This is because losses occur over the holding period. However, you should not use excessively large funds for day trading.
When determining your investment weight, the size of your reserve funds is a crucial factor to consider.
It is recommended to set your reserve funds at approximately 20% of your total investment.
This reserve fund is very important because it can reduce losses from holding positions over time and maximize profits by increasing liquidity.
Therefore, you must limit the number of stocks or coins (tokens) you trade simultaneously to ensure you have the capacity to respond when volatility occurs.
3. Buy Point (Trading Method)
This refers to the actual trading method used to decide how to buy and sell when a trade is executed.
To this end, we gather information in various ways and proceed with trading.
At this stage, the key is securing liquidity and determining the method for realizing profits.
If you trade your currently held stocks or coins (tokens) according to your investment period, generate a profit, and close the trade, it can be considered a good trade. However, since this is not always the case, you must constantly think about how to respond within the investment period to maximize profits.
If the price falls below the average purchase price and turns into a loss, we end up investing more capital to lower the average purchase price.
However, if the price continues to fall, we reach a point where we can no longer do anything and end up giving up.
To prevent this, it is necessary to relax the trading method more comprehensively.
In other words, instead of trading based on the average purchase price, you should trade based on individual purchase prices.
For example, assuming the average purchase price is $100,
if you bought when the current price showed support around $90,
if the price subsequently rises to $93 and shows resistance,
you can realize a profit by selling the quantity purchased around $90 at $93.
Although it is recorded as a loss when viewed from the perspective of the average purchase price, the actual amount increases.
To trade in this manner, support and resistance points established on the 1M, 1W, and 1D charts are essential.
You must verify whether support is maintained at these points and proceed with your trade accordingly.
The indicators used to initiate a buy order are the DOM(-60) and HA-Low indicators.
These two indicators represent low points, and if support is confirmed at them, there is a high probability that the price will rise.
Therefore, when encountering the DOM(-60) and HA-Low indicators, you must focus on finding the optimal trading timing; once you have decided to trade, you must execute the trade decisively.
The price may fall even after encountering the DOM(-60) and HA-Low indicators.
Therefore, you must verify whether support is present.
However, if the price falls after encountering the DOM(-60) and HA-Low indicators, it will exhibit a stepwise downtrend.
This stepwise downtrend will eventually form a bottom and provide the impetus for a reversal to an upward trend. Therefore, it is necessary to trade consistently until the market turns upward to generate profits while lowering the average purchase price.
To achieve this, adjusting your investment weight is crucial.
There are people who make profits even without understanding charts.
Even if these individuals cannot explain their trading methods, they can be seen as possessing the ability to adapt to their own investment style.
However, there are occasionally those who make profits by blindly buying at very low price levels and waiting indefinitely...

YouTube: youtube.com/@readcrypto9837
※ Follow X to check out the posts.
※ X를 팔로우하고 게시물을 확인하세요.
◆ t.me/readCryptoChannel
[HA-MS Indicator]
bit.ly/3YxHgvN
[OBV Indicator]
bit.ly/4dcyny3
※ Follow X to check out the posts.
※ X를 팔로우하고 게시물을 확인하세요.
◆ t.me/readCryptoChannel
[HA-MS Indicator]
bit.ly/3YxHgvN
[OBV Indicator]
bit.ly/4dcyny3
Похожие публикации
Отказ от ответственности
Информация и публикации не предназначены для предоставления и не являются финансовыми, инвестиционными, торговыми или другими видами советов или рекомендаций, предоставленных или одобренных TradingView. Подробнее читайте в Условиях использования.
YouTube: youtube.com/@readcrypto9837
※ Follow X to check out the posts.
※ X를 팔로우하고 게시물을 확인하세요.
◆ t.me/readCryptoChannel
[HA-MS Indicator]
bit.ly/3YxHgvN
[OBV Indicator]
bit.ly/4dcyny3
※ Follow X to check out the posts.
※ X를 팔로우하고 게시물을 확인하세요.
◆ t.me/readCryptoChannel
[HA-MS Indicator]
bit.ly/3YxHgvN
[OBV Indicator]
bit.ly/4dcyny3
Похожие публикации
Отказ от ответственности
Информация и публикации не предназначены для предоставления и не являются финансовыми, инвестиционными, торговыми или другими видами советов или рекомендаций, предоставленных или одобренных TradingView. Подробнее читайте в Условиях использования.