
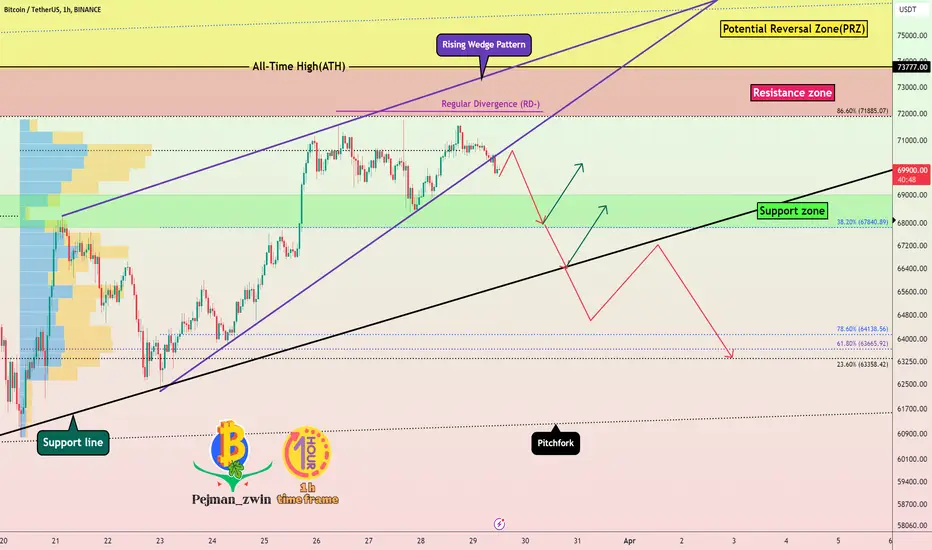
🏃♂️Bitcoin is moving near the 🔴Resistance zone($73,700-$71,800)🔴. Above the 🔴Resistance zone($73,700-$71,800)🔴is also an important 🟡Potential Reversal Zone(PRZ)($82,800-$73,700)🟡.
📈From the point of view of Classic Technical Analysis, it seems that Bitcoin has succeeded in breaking the lower line of the Rising Wedge Pattern, and there is also the possibility of forming a Double Top Pattern.
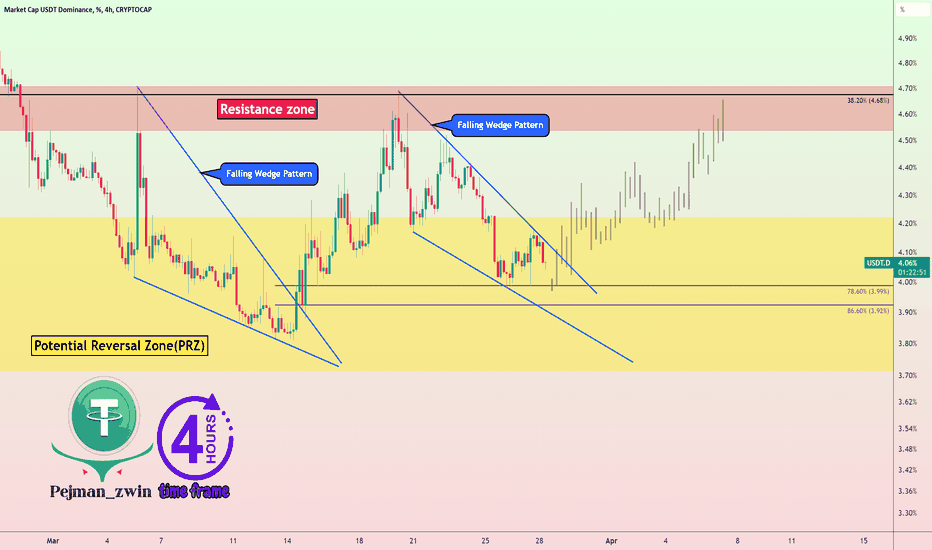
📈We can also look at the Market Cap USDT Dominance% (USDT.D%) chart for a better analysis of Bitcoin. Yesterday, I analyzed USDT.D% for you.
📈USDT.D% has succeeded in breaking the upper line of the Falling wedge, and this is good news, which confirms the breaking of the lower line of the Rising Wedge Pattern in the Bitcoin chart.👇
📈Also, the Market Cap BTC Dominance% (BTC.D%) chart will also be bearish and can help the fall of Bitcoin.👇

🔔I expect Bitcoin will Go Down at least to the 🟢Support zone($69,000-$67,800)🟢, and if it breaks, we can expect BTC will go down to the Support line and Fibonacci cluster.
❗️⚠️Note⚠️❗️: An important point you should always remember is capital management and lack of greed.
Bitcoin Analyze ( BTCUSDT ), 1-hour time frame ⏰.
Do not forget to put Stop loss for your positions (For every position you want to open).
Please follow your strategy; this is just my Idea, and I will gladly see your ideas in this post.
Please do not forget the ✅' like'✅ button 🙏😊 & Share it with your friends; thanks, and Trade safe.
📈From the point of view of Classic Technical Analysis, it seems that Bitcoin has succeeded in breaking the lower line of the Rising Wedge Pattern, and there is also the possibility of forming a Double Top Pattern.
📈We can also look at the Market Cap USDT Dominance% (USDT.D%) chart for a better analysis of Bitcoin. Yesterday, I analyzed USDT.D% for you.
📈USDT.D% has succeeded in breaking the upper line of the Falling wedge, and this is good news, which confirms the breaking of the lower line of the Rising Wedge Pattern in the Bitcoin chart.👇
📈Also, the Market Cap BTC Dominance% (BTC.D%) chart will also be bearish and can help the fall of Bitcoin.👇
🔔I expect Bitcoin will Go Down at least to the 🟢Support zone($69,000-$67,800)🟢, and if it breaks, we can expect BTC will go down to the Support line and Fibonacci cluster.
❗️⚠️Note⚠️❗️: An important point you should always remember is capital management and lack of greed.
Bitcoin Analyze ( BTCUSDT ), 1-hour time frame ⏰.
Do not forget to put Stop loss for your positions (For every position you want to open).
Please follow your strategy; this is just my Idea, and I will gladly see your ideas in this post.
Please do not forget the ✅' like'✅ button 🙏😊 & Share it with your friends; thanks, and Trade safe.
Сделка активна
Заметка
Trading volume is low on Saturday and Sunday and we have to wait for the main movement from Monday.Заметка
If it can break the 🟢Support zone($69,000-$67,800)🟢, we can expect the support line to break.Заметка
As I expected, BTC was able to break the 🟢Support zone($69,000-$67,800)🟢 and Support line.
🎁 Free Real VIP Forex and Crypto Signals. Please visit:
🔗 t.me/ProTrader_365
🔗 t.me/ProTrader_365
Похожие публикации
Отказ от ответственности
Информация и публикации не предназначены для предоставления и не являются финансовыми, инвестиционными, торговыми или другими видами советов или рекомендаций, предоставленных или одобренных TradingView. Подробнее читайте в Условиях использования.