
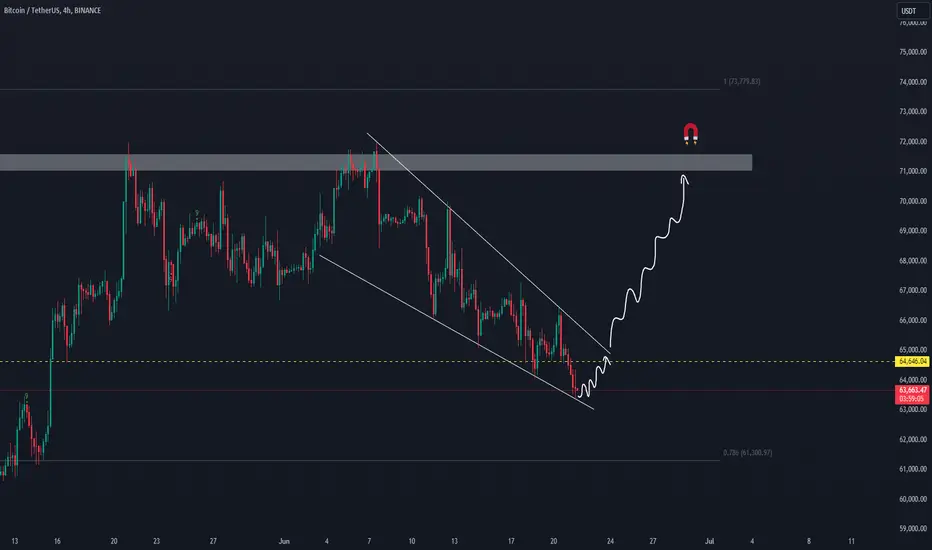
Analyzing the 4-hour Bitcoin chart, we can observe a descending wedge pattern forming. Currently, the price has reached the support line of this formation. If it bounces off this support and breaks through the resistance line, it will confirm the upward momentum. These patterns typically indicate a bullish reversal, leading to a potential rise. Target: Bitcoin (BTC) Target: $71,000, expected to be reached within a week. Let's keep an eye on this pattern for a breakout to confirm the bullish scenario!

Отказ от ответственности
Информация и публикации не предназначены для предоставления и не являются финансовыми, инвестиционными, торговыми или другими видами советов или рекомендаций, предоставленных или одобренных TradingView. Подробнее читайте в Условиях использования.
Отказ от ответственности
Информация и публикации не предназначены для предоставления и не являются финансовыми, инвестиционными, торговыми или другими видами советов или рекомендаций, предоставленных или одобренных TradingView. Подробнее читайте в Условиях использования.