
Hello everyone! If you enjoy this content, please consider giving it a like and following for more updates.
Welcome to your BTC/USDT Quick Update!
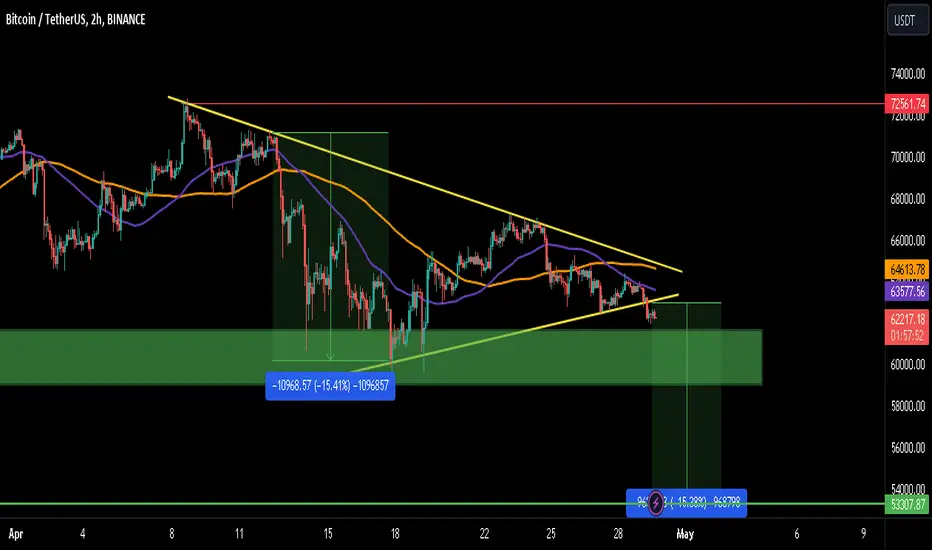
The chart on a lower timeframe shows a breakout from the symmetrical triangle, indicating a potential bearish trend. However, strong support sits at the $59,000-$60,000 level. We might see a bounce from there. If we break below this support, there's a high chance of visiting the $52,000-$53,000 level.
What do you think about this?
Share your views in the comment section.
Thank You!
Welcome to your BTC/USDT Quick Update!
The chart on a lower timeframe shows a breakout from the symmetrical triangle, indicating a potential bearish trend. However, strong support sits at the $59,000-$60,000 level. We might see a bounce from there. If we break below this support, there's a high chance of visiting the $52,000-$53,000 level.
What do you think about this?
Share your views in the comment section.
Thank You!

Похожие публикации
Отказ от ответственности
Информация и публикации не предназначены для предоставления и не являются финансовыми, инвестиционными, торговыми или другими видами советов или рекомендаций, предоставленных или одобренных TradingView. Подробнее читайте в Условиях использования.
Похожие публикации
Отказ от ответственности
Информация и публикации не предназначены для предоставления и не являются финансовыми, инвестиционными, торговыми или другими видами советов или рекомендаций, предоставленных или одобренных TradingView. Подробнее читайте в Условиях использования.