
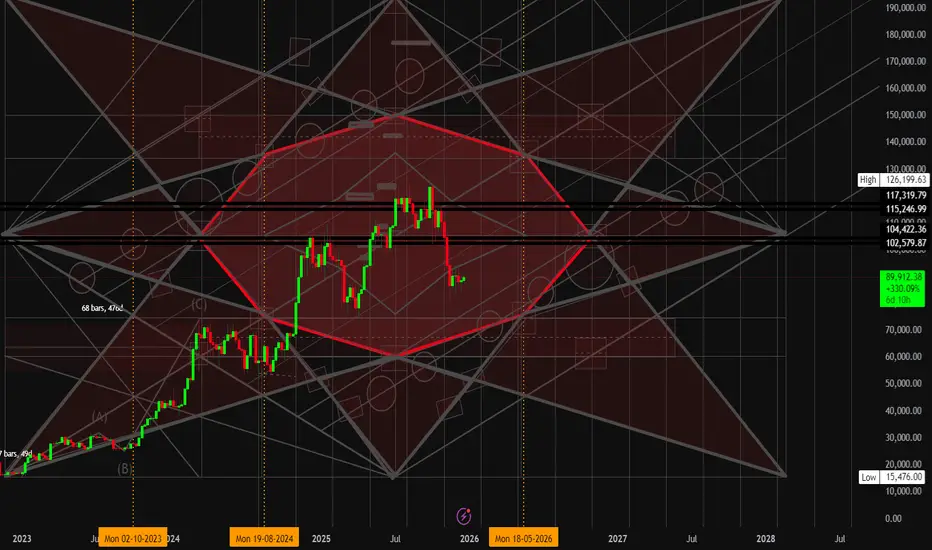
I have built a Gann Star structure that generates highly effective trend lines in accordance with Gann’s principles.
Currently, Bitcoin is trading within the octagonal structure, which confirms the validity of the Gann Star. The key levels have been defined based on Gann theory and Fibonacci ratios:
0.618 | 1.618 | 2.618 | 3.618 | 4.618, derived from multiple swing highs and lows.
This methodology previously allowed us to accurately anticipate the 121K Bitcoin top (published on April 15, 2024), and to this day, price continues to respect both the trend lines and the orthogonal Fibonacci levels projected from several major highs and lows, according to the ratios mentioned above.
We are now entering a highly critical phase. After price moved into the octagon, we are currently monitoring the vertical time intersections plotted on the chart, highlighted by a dotted orange vertical line. At this point, price is expected to move toward the small rectangular zone, which intersects with the larger octagonal structure.
If price accelerates toward this area and breaks above that level, it would suggest a transition into a low-volatility, balanced market phase, where highs and lows tend to equalize—indicating that price has arrived earlier than the projected time window.
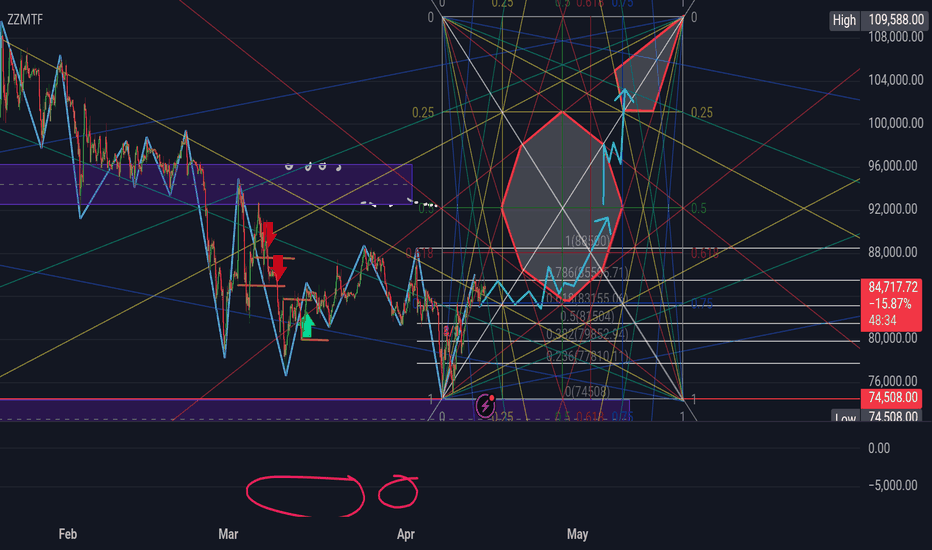
Old Gann stare published on April 15, 2024
Currently, Bitcoin is trading within the octagonal structure, which confirms the validity of the Gann Star. The key levels have been defined based on Gann theory and Fibonacci ratios:
0.618 | 1.618 | 2.618 | 3.618 | 4.618, derived from multiple swing highs and lows.
This methodology previously allowed us to accurately anticipate the 121K Bitcoin top (published on April 15, 2024), and to this day, price continues to respect both the trend lines and the orthogonal Fibonacci levels projected from several major highs and lows, according to the ratios mentioned above.
We are now entering a highly critical phase. After price moved into the octagon, we are currently monitoring the vertical time intersections plotted on the chart, highlighted by a dotted orange vertical line. At this point, price is expected to move toward the small rectangular zone, which intersects with the larger octagonal structure.
If price accelerates toward this area and breaks above that level, it would suggest a transition into a low-volatility, balanced market phase, where highs and lows tend to equalize—indicating that price has arrived earlier than the projected time window.
Old Gann stare published on April 15, 2024
Заметка
Заметка
BTC/USDT--> 123k
--> 150k
--> 186k
--> 201k

Отказ от ответственности
Информация и публикации не предназначены для предоставления и не являются финансовыми, инвестиционными, торговыми или другими видами советов или рекомендаций, предоставленных или одобренных TradingView. Подробнее читайте в Условиях использования.
Отказ от ответственности
Информация и публикации не предназначены для предоставления и не являются финансовыми, инвестиционными, торговыми или другими видами советов или рекомендаций, предоставленных или одобренных TradingView. Подробнее читайте в Условиях использования.