
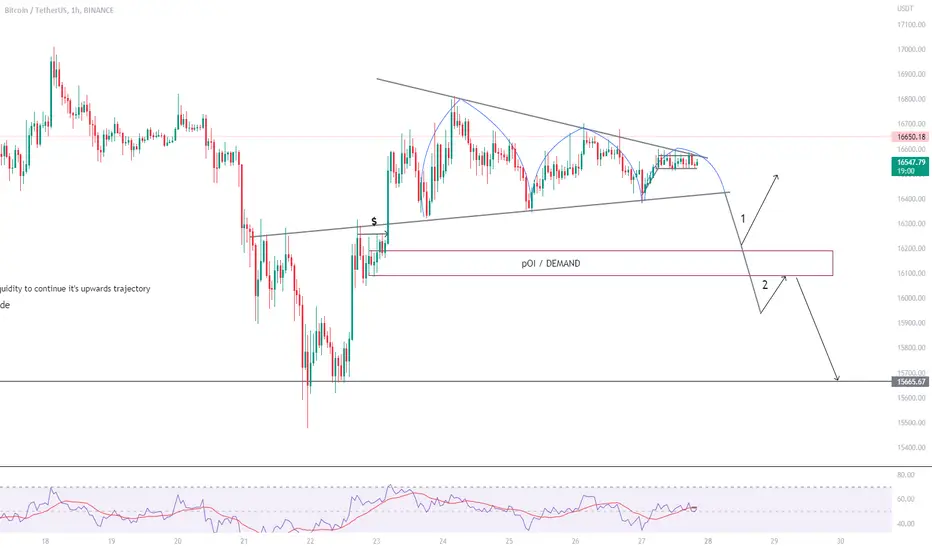
1- The triple top is a chart pattern used in technical analysis to predict a reversal in the price movement of an asset. A triple top indicates that the asset is no longer rallying and that lower prices are expected.
2- We have a level of demand below it, so the price must come to that level and have a big bounce to continue rising.
3- In scenario 2, the price will break the demand, retest it, and then continue to the lower resistance, where it will consolidate, then reach the 12 k area due to market fear.
2- We have a level of demand below it, so the price must come to that level and have a big bounce to continue rising.
3- In scenario 2, the price will break the demand, retest it, and then continue to the lower resistance, where it will consolidate, then reach the 12 k area due to market fear.

Отказ от ответственности
Информация и публикации не предназначены для предоставления и не являются финансовыми, инвестиционными, торговыми или другими видами советов или рекомендаций, предоставленных или одобренных TradingView. Подробнее читайте в Условиях использования.
Отказ от ответственности
Информация и публикации не предназначены для предоставления и не являются финансовыми, инвестиционными, торговыми или другими видами советов или рекомендаций, предоставленных или одобренных TradingView. Подробнее читайте в Условиях использования.