

Today, we will show our view on CADCHF based on Daily and weekly timeframes.
Weekly Chart:

The price is on a major support zone, and we saw a clear rejection there. Now we can see a local trendline about to be broken, and we expect a bullish resolution towards the next resistance zone. (Descending Trendline.
Daily Chart:
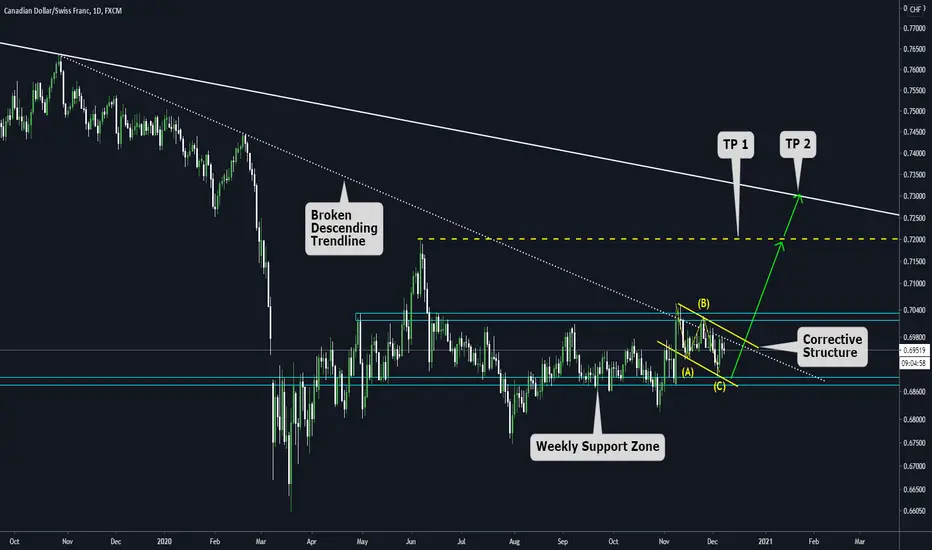
Here we have a more zoomed view of the Weekly chart, and we can see a corrective structure on the edge of the broken descending trendline. If we have a breakout of the ABC pattern, we expect a continuation movement towards the next resistance zone (TP1) and a Final Target on the Weekly descending trendline (TP2)
Weekly Chart:
The price is on a major support zone, and we saw a clear rejection there. Now we can see a local trendline about to be broken, and we expect a bullish resolution towards the next resistance zone. (Descending Trendline.
Daily Chart:
Here we have a more zoomed view of the Weekly chart, and we can see a corrective structure on the edge of the broken descending trendline. If we have a breakout of the ABC pattern, we expect a continuation movement towards the next resistance zone (TP1) and a Final Target on the Weekly descending trendline (TP2)

Отказ от ответственности
Информация и публикации не предназначены для предоставления и не являются финансовыми, инвестиционными, торговыми или другими видами советов или рекомендаций, предоставленных или одобренных TradingView. Подробнее читайте в Условиях использования.
Отказ от ответственности
Информация и публикации не предназначены для предоставления и не являются финансовыми, инвестиционными, торговыми или другими видами советов или рекомендаций, предоставленных или одобренных TradingView. Подробнее читайте в Условиях использования.