
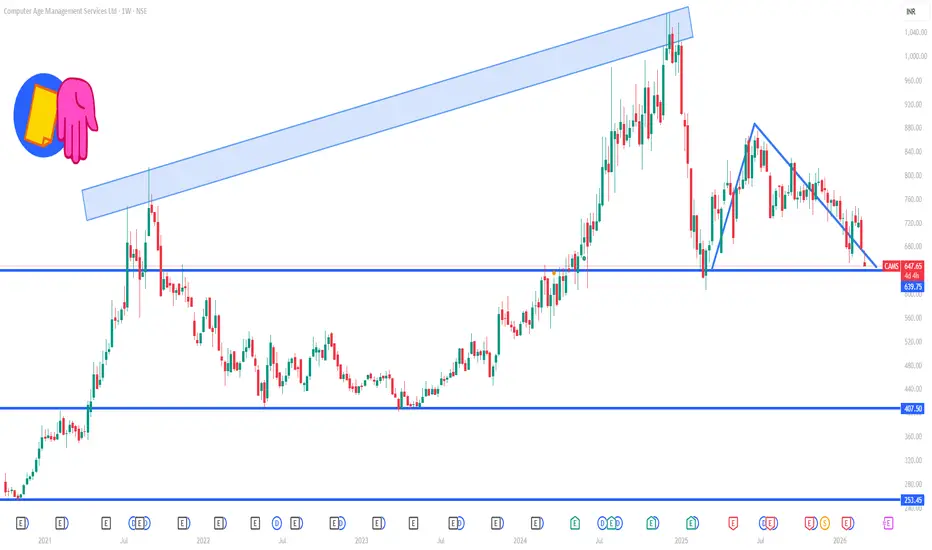
📊 Current Context (Weekly Frame)
The stock recently traded around ~₹650–₹680 on NSE, and has been moving lower in the short term on the weekly chart.
Weekly momentum signals have been negative/bearish, with downside movement dominating.
🧭 Weekly Support Levels
Key support zones to watch on a 1-week timeframe:
~₹650–₹660 — nearest support range where recent lows cluster.
~₹630–₹640 — secondary support buffer if the first level is broken (close to the lower side of the most recent weekly range).
~₹606 — 52-week low boundary, major structural support zone.
A weekly close below ₹650 could tilt the short term tone more bearish.
🔝 Weekly Resistance Levels
Key resistance zones on weekly time frame:
~₹690–₹700 — first resistance on weekly bounce attempts (near recent swing highs).
~₹710–₹720 — psychological supply zone and near short-term pivot region.
~₹740–₹750 — higher resistance belt defined by prior weekly pivots and range tops.
A sustained weekly close above ~₹700-₹710 would be needed to suggest a recovery bias.
📌 Weekly Pivot / Mid Levels (Indicative)
Weekly pivot approx: ~₹690–₹700 zone (short-term equilibrium).
Price above pivot → weekly bullish bias; below pivot → weekly bearish bias.
The stock recently traded around ~₹650–₹680 on NSE, and has been moving lower in the short term on the weekly chart.
Weekly momentum signals have been negative/bearish, with downside movement dominating.
🧭 Weekly Support Levels
Key support zones to watch on a 1-week timeframe:
~₹650–₹660 — nearest support range where recent lows cluster.
~₹630–₹640 — secondary support buffer if the first level is broken (close to the lower side of the most recent weekly range).
~₹606 — 52-week low boundary, major structural support zone.
A weekly close below ₹650 could tilt the short term tone more bearish.
🔝 Weekly Resistance Levels
Key resistance zones on weekly time frame:
~₹690–₹700 — first resistance on weekly bounce attempts (near recent swing highs).
~₹710–₹720 — psychological supply zone and near short-term pivot region.
~₹740–₹750 — higher resistance belt defined by prior weekly pivots and range tops.
A sustained weekly close above ~₹700-₹710 would be needed to suggest a recovery bias.
📌 Weekly Pivot / Mid Levels (Indicative)
Weekly pivot approx: ~₹690–₹700 zone (short-term equilibrium).
Price above pivot → weekly bullish bias; below pivot → weekly bearish bias.

Contact Knowledgehub for a detailed consultation: Dm on WhatsApp: [wa.link/a2o0kz]-
Phone No: [+91 93102 26243]-
Email: [tradingviewknowledgehub@gmail.com]---
-- Let’s achieve success together!
Phone No: [+91 93102 26243]-
Email: [tradingviewknowledgehub@gmail.com]---
-- Let’s achieve success together!
Похожие публикации
Отказ от ответственности
Информация и публикации не предназначены для предоставления и не являются финансовыми, инвестиционными, торговыми или другими видами советов или рекомендаций, предоставленных или одобренных TradingView. Подробнее читайте в Условиях использования.
Contact Knowledgehub for a detailed consultation: Dm on WhatsApp: [wa.link/a2o0kz]-
Phone No: [+91 93102 26243]-
Email: [tradingviewknowledgehub@gmail.com]---
-- Let’s achieve success together!
Phone No: [+91 93102 26243]-
Email: [tradingviewknowledgehub@gmail.com]---
-- Let’s achieve success together!
Похожие публикации
Отказ от ответственности
Информация и публикации не предназначены для предоставления и не являются финансовыми, инвестиционными, торговыми или другими видами советов или рекомендаций, предоставленных или одобренных TradingView. Подробнее читайте в Условиях использования.