
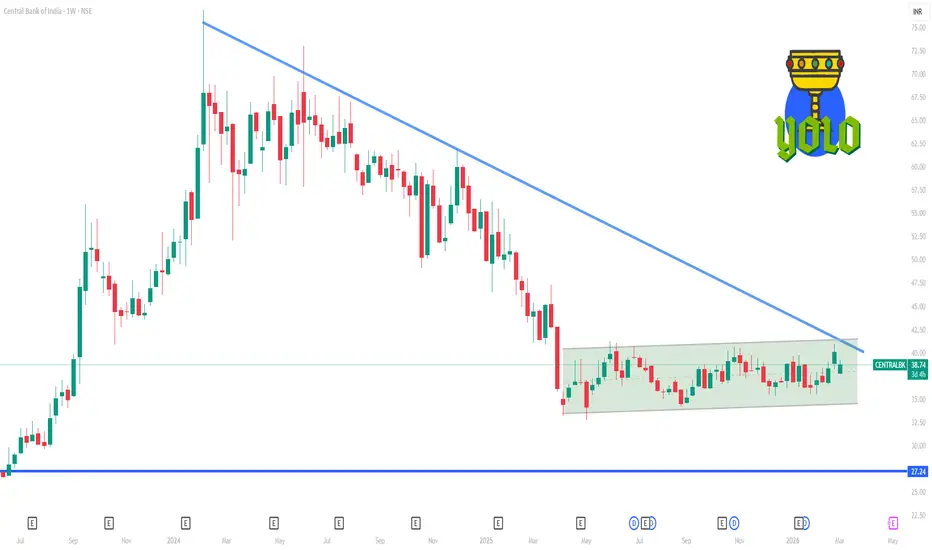
📊 Current Snapshot (as of early March 2026)
Recent price ~ ₹38.7 – ₹39.0 on the NSE.
52-week range: Low ~ ₹32.7, High ~ ₹47.3.
🔑 Weekly Time Frame Levels (1-week support & resistance)
📈 Resistance Zones
These are levels that the price may struggle to cross above in the near term:
₹39.0–39.4: near current pivot and immediate weekly resistance.
₹40.2–40.4: next resistance cluster — break above this helps bullish continuation.
₹41+: overhead bigger resistance if upside momentum builds.
Key Weekly Resistances:
🔥 R1 ~ ₹39.1
🔥 R2 ~ ₹39.45–39.99
🔥 R3 ~ ₹40.25–40.44
📉 Support Zones
Important levels where the price may find buyers on dips:
₹38.0–38.6: first line of support (near short-term moving averages & pivot-based support).
₹37.4–37.7: deeper weekly support — breach could hint at more correction.
₹36.8–36.0: larger lower support cluster if broader weakness appears.
Key Weekly Supports:
🛡️ S1 ~ ₹38.0–38.6
🛡️ S2 ~ ₹37.4–37.7
🛡️ S3 ~ ₹36.8–36.0
📌 Interpretation (Weekly)
Bullish bias on weekly breakout above ~₹40.4 — strengthens medium-term uptrend if confirmed on volume.
Bearish continuation below ~₹37.4 — could signal downside trend continuation within the recent range.
Between ₹38–40 is currently the key consolidation range traders watch this week.
📊 Other Notes
Many oscillator and moving average indicators (like RSI) around neutral to slightly bullish on weekly charts — so breakout direction matters more than current momentum.
Classic pivot studies often give additional weekly pivot values near ₹37.1–38.0 as key reaction points.

Contact Knowledgehub for a detailed consultation: Dm on WhatsApp: [wa.link/a2o0kz]-
Phone No: [+91 93102 26243]-
Email: [tradingviewknowledgehub@gmail.com]---
-- Let’s achieve success together!
Phone No: [+91 93102 26243]-
Email: [tradingviewknowledgehub@gmail.com]---
-- Let’s achieve success together!
Похожие публикации
Отказ от ответственности
Информация и публикации не предназначены для предоставления и не являются финансовыми, инвестиционными, торговыми или другими видами советов или рекомендаций, предоставленных или одобренных TradingView. Подробнее читайте в Условиях использования.