
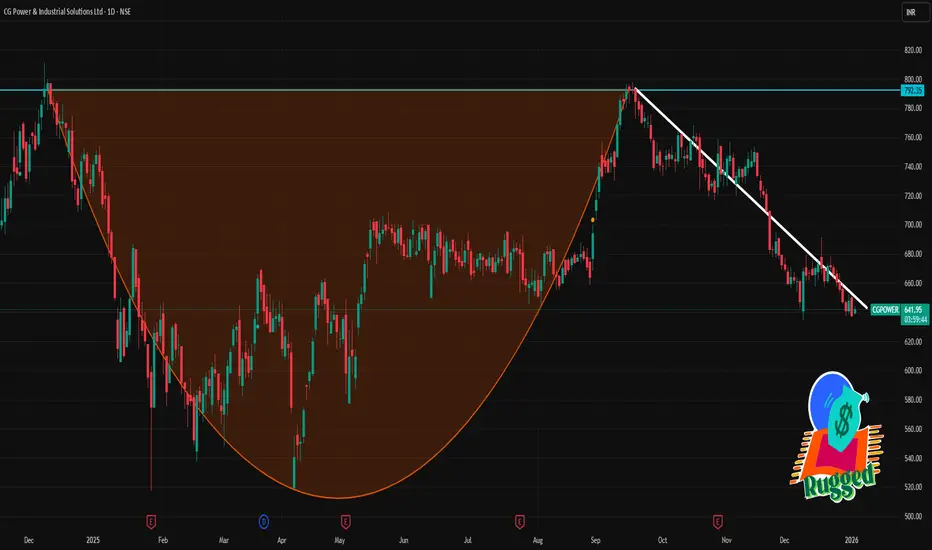
📊 Daily Price Levels (1D Time Frame)
Current price range (recent session)
• Day’s trading range ~ ₹634–₹651 approx on NSE (latest close ~ ₹637–₹647) (as per recent data)
Pivot / Pivot‑based levels
• Daily Pivot: ~ ₹662 (central reference)
(use this as a neutral baseline — above favors bullish bias, below favors bearish bias)
Immediate Resistance
1️⃣ R1 ~ ₹665–₹668 (zone of immediate selling pressure)
2️⃣ R2 ~ ₹675–₹680 (next upside barrier)
3️⃣ Higher resistance (secondary) ~ ₹685–₹695+ (seen in other pivot data)
Immediate Support
1️⃣ S1 ~ ₹656–₹650 (first support zone)
2️⃣ S2 ~ ₹644–₹640 (next downside support)
3️⃣ S3 ~ ₹627–₹630 (deeper support)
📌 Interpretation (1‑Day)
If price holds above ₹656–₹650, the bias may stabilize and test ₹665–₹675 on the upside.
Break below ₹640–₹630 increases risk of further weakness in the short run.
Daily pivot at ~₹662 helps gauge short‑term trend — sustaining above it hints at short‑term buying interest, below it suggests continued pressure.
(These levels are typical pivot/sr zones used by traders; use live charts for exact current quotes.)
🧠 Extra Context (Technical Indicators)
Short‑term technical indicators (RSI & moving averages) have shown mixed to bearish signals recently, with several daily sell signals noted in external analysis.
Current price range (recent session)
• Day’s trading range ~ ₹634–₹651 approx on NSE (latest close ~ ₹637–₹647) (as per recent data)
Pivot / Pivot‑based levels
• Daily Pivot: ~ ₹662 (central reference)
(use this as a neutral baseline — above favors bullish bias, below favors bearish bias)
Immediate Resistance
1️⃣ R1 ~ ₹665–₹668 (zone of immediate selling pressure)
2️⃣ R2 ~ ₹675–₹680 (next upside barrier)
3️⃣ Higher resistance (secondary) ~ ₹685–₹695+ (seen in other pivot data)
Immediate Support
1️⃣ S1 ~ ₹656–₹650 (first support zone)
2️⃣ S2 ~ ₹644–₹640 (next downside support)
3️⃣ S3 ~ ₹627–₹630 (deeper support)
📌 Interpretation (1‑Day)
If price holds above ₹656–₹650, the bias may stabilize and test ₹665–₹675 on the upside.
Break below ₹640–₹630 increases risk of further weakness in the short run.
Daily pivot at ~₹662 helps gauge short‑term trend — sustaining above it hints at short‑term buying interest, below it suggests continued pressure.
(These levels are typical pivot/sr zones used by traders; use live charts for exact current quotes.)
🧠 Extra Context (Technical Indicators)
Short‑term technical indicators (RSI & moving averages) have shown mixed to bearish signals recently, with several daily sell signals noted in external analysis.

Contact Knowledgehub for a detailed consultation: Dm on WhatsApp: [wa.link/a2o0kz]-
Phone No: [+91 93102 26243]-
Email: [tradingviewknowledgehub@gmail.com]---
-- Let’s achieve success together!
Phone No: [+91 93102 26243]-
Email: [tradingviewknowledgehub@gmail.com]---
-- Let’s achieve success together!
Похожие публикации
Отказ от ответственности
Информация и публикации не предназначены для предоставления и не являются финансовыми, инвестиционными, торговыми или другими видами советов или рекомендаций, предоставленных или одобренных TradingView. Подробнее читайте в Условиях использования.
Contact Knowledgehub for a detailed consultation: Dm on WhatsApp: [wa.link/a2o0kz]-
Phone No: [+91 93102 26243]-
Email: [tradingviewknowledgehub@gmail.com]---
-- Let’s achieve success together!
Phone No: [+91 93102 26243]-
Email: [tradingviewknowledgehub@gmail.com]---
-- Let’s achieve success together!
Похожие публикации
Отказ от ответственности
Информация и публикации не предназначены для предоставления и не являются финансовыми, инвестиционными, торговыми или другими видами советов или рекомендаций, предоставленных или одобренных TradingView. Подробнее читайте в Условиях использования.