
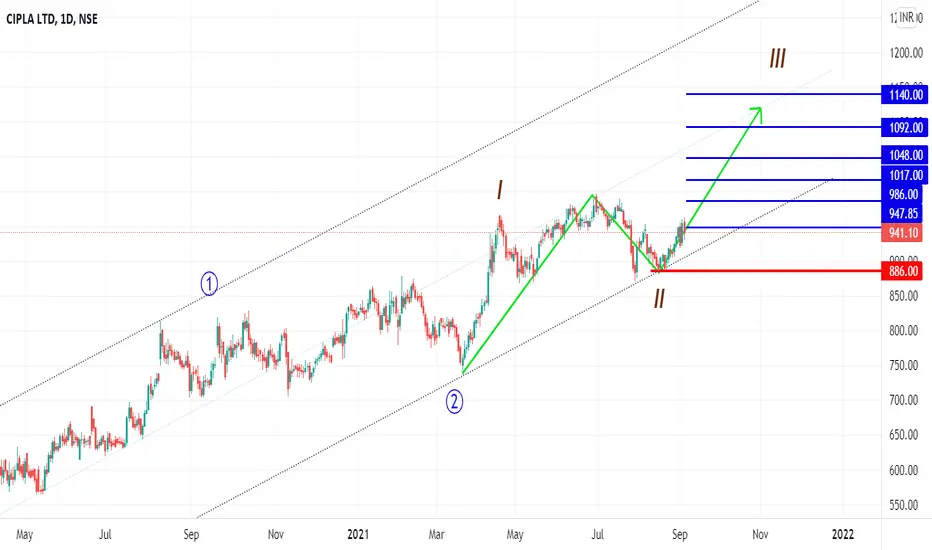
Cipla,
this stock tested weekly lower bollinger band and bounced back sharply recently, also positive crossover has done in the weekly oscillator stochastic indicator.
the wave structure suggests that it is in a larger degree wave 3 which is getting subdivided.
within wave 3, the stock has completed wave I and II and it is currently in wave III of 3, as wave III unfolds , the stock can posiibly rise higher towards 1120.
one can go long at these levels or in dips ( if any ) with stoploss of last swing low 886.
Wave structure

key levels are mentioned on chart

weekly stochastic turned positive

weekly rsi uptick near 60

bollinger and price action in weekly

bollinger and price action in daily

Disclaimer
I am not sebi registered analyst
My studies are for educational purpose only
Consult your financial advisor before trading or investing
this stock tested weekly lower bollinger band and bounced back sharply recently, also positive crossover has done in the weekly oscillator stochastic indicator.
the wave structure suggests that it is in a larger degree wave 3 which is getting subdivided.
within wave 3, the stock has completed wave I and II and it is currently in wave III of 3, as wave III unfolds , the stock can posiibly rise higher towards 1120.
one can go long at these levels or in dips ( if any ) with stoploss of last swing low 886.
Wave structure
key levels are mentioned on chart
weekly stochastic turned positive
weekly rsi uptick near 60
bollinger and price action in weekly
bollinger and price action in daily
Disclaimer
I am not sebi registered analyst
My studies are for educational purpose only
Consult your financial advisor before trading or investing

YouTube: youtube.com/@rk_charts
Telegram : t.me/RK_Charts
Twitter : @charts_rk
Email : rkcharts@gmail. com
Disclaimer.
I am not sebi registered analyst.
My studies are for educational purpose only.
Telegram : t.me/RK_Charts
Twitter : @charts_rk
Email : rkcharts@gmail. com
Disclaimer.
I am not sebi registered analyst.
My studies are for educational purpose only.
Похожие публикации
Отказ от ответственности
Информация и публикации не предназначены для предоставления и не являются финансовыми, инвестиционными, торговыми или другими видами советов или рекомендаций, предоставленных или одобренных TradingView. Подробнее читайте в Условиях использования.
YouTube: youtube.com/@rk_charts
Telegram : t.me/RK_Charts
Twitter : @charts_rk
Email : rkcharts@gmail. com
Disclaimer.
I am not sebi registered analyst.
My studies are for educational purpose only.
Telegram : t.me/RK_Charts
Twitter : @charts_rk
Email : rkcharts@gmail. com
Disclaimer.
I am not sebi registered analyst.
My studies are for educational purpose only.
Похожие публикации
Отказ от ответственности
Информация и публикации не предназначены для предоставления и не являются финансовыми, инвестиционными, торговыми или другими видами советов или рекомендаций, предоставленных или одобренных TradingView. Подробнее читайте в Условиях использования.