
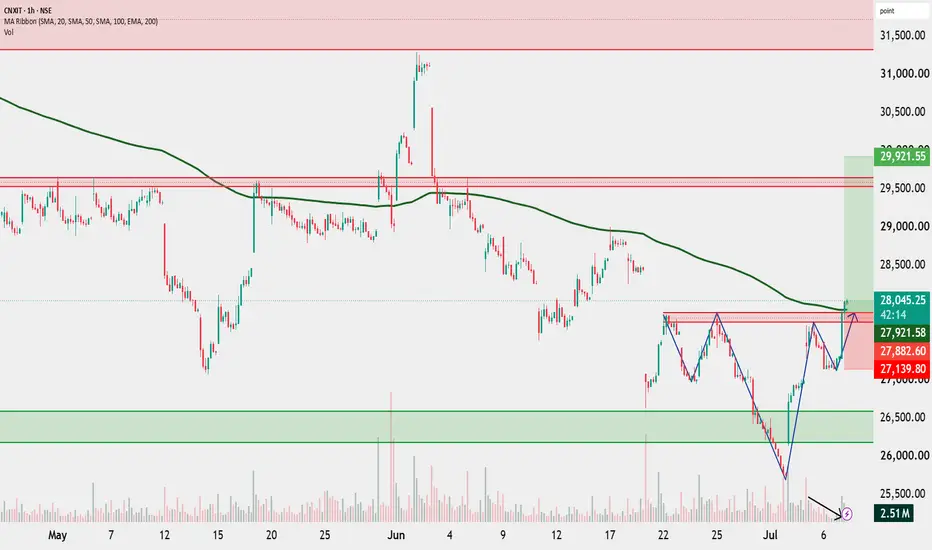
CNX IT is forming an Inverse Head and Shoulder pattern while also showing a bullish market structure with higher highs and higher lows after a Change of Character (ChoCH). Price is testing the neckline and the 200 EMA, making this a crucial resistance zone. A sustained close above 27,900–28,000 would confirm a Break of Structure (BOS) and strengthen the bullish outlook. Volume has declined during the pullback, indicating weak selling pressure. Wait for a confirmed breakout before taking any position.
Disclaimer: For educational purposes only. Not an investment recommendation. Please consult your registered financial advisor. I am only a SEBI Certified Research Analyst.
Disclaimer: For educational purposes only. Not an investment recommendation. Please consult your registered financial advisor. I am only a SEBI Certified Research Analyst.

Похожие публикации
Отказ от ответственности
Информация и публикации не предназначены для предоставления и не являются финансовыми, инвестиционными, торговыми или другими видами советов или рекомендаций, предоставленных или одобренных TradingView. Подробнее читайте в Условиях использования.
Похожие публикации
Отказ от ответственности
Информация и публикации не предназначены для предоставления и не являются финансовыми, инвестиционными, торговыми или другими видами советов или рекомендаций, предоставленных или одобренных TradingView. Подробнее читайте в Условиях использования.