
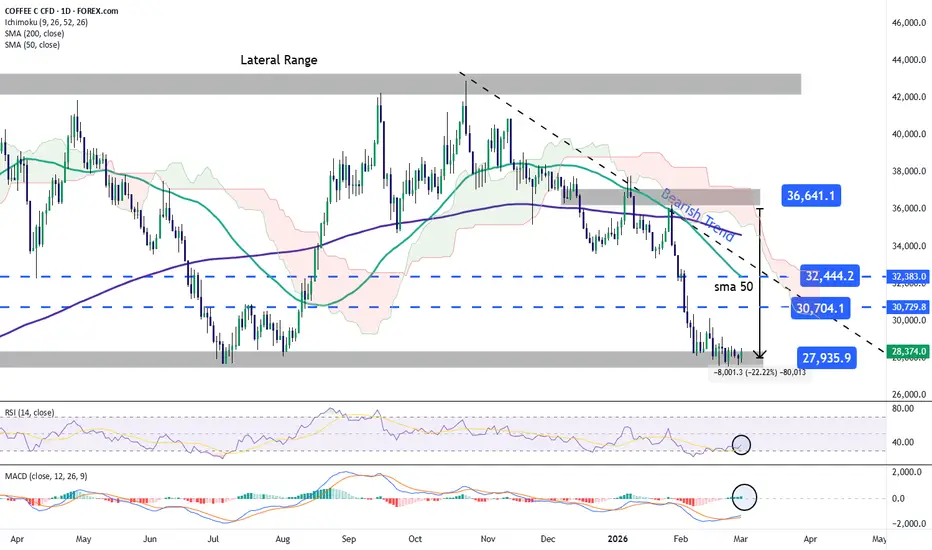
Coffee prices have been under significant pressure in recent weeks. Since the last bullish peak in late January 2026, near the 36,000 level, prices have declined by more than 20%, bringing the market back toward the 28,000 area — levels not seen since mid-2025.
The sustained selling pressure is largely driven by improved supply expectations. Last year, persistent drought conditions significantly limited production in Brazil, the world’s largest coffee producer, accounting for roughly 35%–40% of global output.
However, improved rainfall forecasts in Brazil have begun to reduce the weather risk premium, with better production conditions expected for the 2026 and 2027 harvests. This shift toward a more robust supply outlook has weighed on prices. Additionally, the change in expectations may have triggered institutional liquidation of positions accumulated in previous months. If the improved production outlook holds, selling pressure could remain relevant in the coming sessions.
A New Downtrend Gains Relevance
Since late October 2025, coffee price action has formed a medium-term descending trendline, consolidating a dominant bearish bias in the market.
The price is now approaching key levels not seen since mid-2025. If selling pressure remains consistent, the current downtrend could intensify, potentially leading to more aggressive short-term downside movements.
RSI
The RSI is no longer signaling extreme oversold conditions but continues to trade below the neutral 50 level. This suggests that average momentum over the past 14 sessions remains tilted to the downside. As long as this dynamic persists, bearish pressure is likely to remain dominant in the short term.
MACD
In contrast, the MACD histogram remains close to the zero line, reflecting equilibrium in short-term moving average momentum. This indicates the absence of a strong directional force and leaves room for potential technical corrective rebounds in the coming sessions. However, any such rebounds currently appear insufficient to reverse the broader bearish trend.
Key Levels to Watch
32,444 – Major resistance: This level aligns with the 50-period simple moving average and the descending trendline. Sustained bullish moves toward this area could challenge the current bearish structure and open the door for a short-term buying bias.
30,704 – Near-term barrier: A relevant neutrality zone that may act as a reference level in the event of short-term corrective rallies.
27,935 – Key support: A level not seen since July 2025 and currently the most important downside barrier. A sustained break below this area could reinforce the continuation of the prevailing downtrend and confirm a dominant bearish bias in the medium term.
Written by Julian Pineda, CFA, CMT – Market Analyst
The sustained selling pressure is largely driven by improved supply expectations. Last year, persistent drought conditions significantly limited production in Brazil, the world’s largest coffee producer, accounting for roughly 35%–40% of global output.
However, improved rainfall forecasts in Brazil have begun to reduce the weather risk premium, with better production conditions expected for the 2026 and 2027 harvests. This shift toward a more robust supply outlook has weighed on prices. Additionally, the change in expectations may have triggered institutional liquidation of positions accumulated in previous months. If the improved production outlook holds, selling pressure could remain relevant in the coming sessions.
A New Downtrend Gains Relevance
Since late October 2025, coffee price action has formed a medium-term descending trendline, consolidating a dominant bearish bias in the market.
The price is now approaching key levels not seen since mid-2025. If selling pressure remains consistent, the current downtrend could intensify, potentially leading to more aggressive short-term downside movements.
RSI
The RSI is no longer signaling extreme oversold conditions but continues to trade below the neutral 50 level. This suggests that average momentum over the past 14 sessions remains tilted to the downside. As long as this dynamic persists, bearish pressure is likely to remain dominant in the short term.
MACD
In contrast, the MACD histogram remains close to the zero line, reflecting equilibrium in short-term moving average momentum. This indicates the absence of a strong directional force and leaves room for potential technical corrective rebounds in the coming sessions. However, any such rebounds currently appear insufficient to reverse the broader bearish trend.
Key Levels to Watch
32,444 – Major resistance: This level aligns with the 50-period simple moving average and the descending trendline. Sustained bullish moves toward this area could challenge the current bearish structure and open the door for a short-term buying bias.
30,704 – Near-term barrier: A relevant neutrality zone that may act as a reference level in the event of short-term corrective rallies.
27,935 – Key support: A level not seen since July 2025 and currently the most important downside barrier. A sustained break below this area could reinforce the continuation of the prevailing downtrend and confirm a dominant bearish bias in the medium term.
Written by Julian Pineda, CFA, CMT – Market Analyst

Отказ от ответственности
Информация и публикации не предназначены для предоставления и не являются финансовыми, инвестиционными, торговыми или другими видами советов или рекомендаций, предоставленных или одобренных TradingView. Подробнее читайте в Условиях использования.
Отказ от ответственности
Информация и публикации не предназначены для предоставления и не являются финансовыми, инвестиционными, торговыми или другими видами советов или рекомендаций, предоставленных или одобренных TradingView. Подробнее читайте в Условиях использования.