
...and why retail patterns are often just liquidity traps?
Warning:
This post isn't about a "magic money button". It's about market mechanics.
Very few people follow Copper, but those who do are clearly the ones looking for depth rather than hype.
# - - - - -
Concept:
What is truly "under the hood" of any asset’s price action? Trading is 50% algorithm and 50% probability. Don`t trade if you don`t see a good setup. Trade if you see a good one. And use algorithm if you cannot understand what is going on.
# - - - - -
The Bitter Truth:
We will never know for sure at which point the price will run out of steam. To know that, you’d have to be a market maker or have access to exchange server logs. And the Order Books are designed to mislead us.
The only viable ways to trade profitably in the markets are:
I. Deep swing trading and fundamental analysis (approaching long-term investing).
II. High-frequency HFT algorithms reacting to micro-tick changes.
III. Possessing insider information.
IV. Knowing the behavioral characteristics of one specific asset at a specific time of day.
Since we don't have the capital of institutional funds to pump and dump the market, our only option is to wait. Wait for our trigger and understand where the big money is actually heading.
# - - - - -
Price Delivery Mechanics:
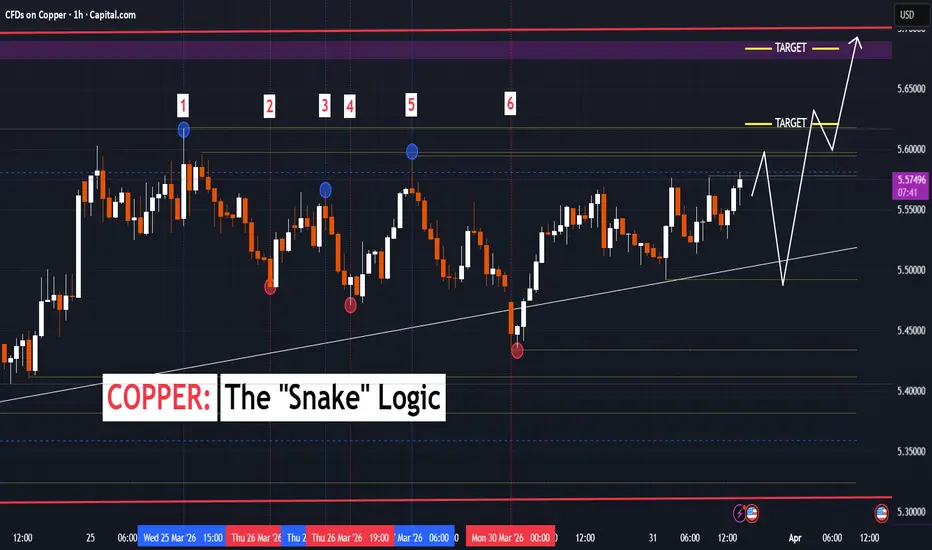
Below, using the 1H Copper chart as an example, I will break down 6 local reversal points.
We’ll look at the targets the price set and why it reversed exactly where retail usually placed their stops.
1. Point 1 is our starting point. It doesn't matter how the price got here or what logic it followed. All we need to know is that liquidity dried up at this point (no orders left, no reason for the price to move further on its own). However, stop-loss orders from those who went long during the entire move to Point 1 have accumulated below.
2. The price seeks to collect this liquidity (like the game "Snake") and drives lower with consecutive sell candles. At Point 2, the player who drove the price down decided to take profits. Since the order book is virtually empty after the drop, the buy-back looks like an aggressive long, convincing retail traders to enter a reversal in anticipation of a trend continuation.
3. The goal of this long is to take out the local high set at Point 1. But because there is no institutional capital behind the move, the price fails to reach the target.
4. Seeing the weakness of the upward move, the new intermediate target is to take out the previous low and sweep the stops of local "long players". The price quickly reaches the previous low and hunts the stops. This is seen with the high wick above the short candle.
By now, the logic for points 5 and 6 should be clear. The price is simply seeking to sweep liquidity from both sides without a strong directional intent. Specifically:
5. A liquidity sweep occurs here with a long-wick candle (stop run) to the upside, followed by a reversal downward.
6. Here, the price made a lower low (below Point 4), but more importantly, it performed a false breakout of the diagonal support line and returned under the accompaniment of strong bullish candles. This movement deserves a "+" as the point that formed local support. An upward move follows.
# - - - - -
Conclusion:
I. Every time you open a trade and set a target, ask yourself: If the price is to reach point X, through which levels must it pass?
II. We can't always understand why the price stopped at a certain point, but if we catch the moment, we can assume where it will go locally. Once it arrives—make a new assumption.
III. For example, the current target for Copper is to sweep the local high at 5.6171. What happens next is unknown. What happens before that? A correction to 5.4924 would be locally counterproductive; it's more logical to sweep the high first and then assess market sentiment.
IV. However, logic doesn't always work, as the price has already failed to break the local "wall" at 5.58 three times. It’s a matter of time, but it might pull back lower to gain momentum.
V. Once the target is hit, the picture resets, and we wait to see where the "Snake" wants to crawl next. Will it hold above? Will it drop immediately? There is a particular probability that after a new high, we will see a liquidity sweep down to 5.49 or even 5.41.
VI. But looking at the patterns and higher liquidity zones, the target at 5.685 looks very tempting.
# - - - - -
So, what's the move? Long? Short? Observation? My scenario is on the chart. Share yours for comparison.
# - - - - -
P.S. Trading isn't about predicting the future. It’s about countering the assumption of exactly where the algorithm or big capital is going to deceive us.
# - - - - -
DISCLAIMER: Not financial advice. Everyone must make trading decisions at their own risk, guided only by their own criteria and strategy for opening or not opening a trade.
Warning:
This post isn't about a "magic money button". It's about market mechanics.
Very few people follow Copper, but those who do are clearly the ones looking for depth rather than hype.
# - - - - -
Concept:
What is truly "under the hood" of any asset’s price action? Trading is 50% algorithm and 50% probability. Don`t trade if you don`t see a good setup. Trade if you see a good one. And use algorithm if you cannot understand what is going on.
# - - - - -
The Bitter Truth:
We will never know for sure at which point the price will run out of steam. To know that, you’d have to be a market maker or have access to exchange server logs. And the Order Books are designed to mislead us.
The only viable ways to trade profitably in the markets are:
I. Deep swing trading and fundamental analysis (approaching long-term investing).
II. High-frequency HFT algorithms reacting to micro-tick changes.
III. Possessing insider information.
IV. Knowing the behavioral characteristics of one specific asset at a specific time of day.
Since we don't have the capital of institutional funds to pump and dump the market, our only option is to wait. Wait for our trigger and understand where the big money is actually heading.
# - - - - -
Price Delivery Mechanics:
Below, using the 1H Copper chart as an example, I will break down 6 local reversal points.
We’ll look at the targets the price set and why it reversed exactly where retail usually placed their stops.
1. Point 1 is our starting point. It doesn't matter how the price got here or what logic it followed. All we need to know is that liquidity dried up at this point (no orders left, no reason for the price to move further on its own). However, stop-loss orders from those who went long during the entire move to Point 1 have accumulated below.
2. The price seeks to collect this liquidity (like the game "Snake") and drives lower with consecutive sell candles. At Point 2, the player who drove the price down decided to take profits. Since the order book is virtually empty after the drop, the buy-back looks like an aggressive long, convincing retail traders to enter a reversal in anticipation of a trend continuation.
3. The goal of this long is to take out the local high set at Point 1. But because there is no institutional capital behind the move, the price fails to reach the target.
4. Seeing the weakness of the upward move, the new intermediate target is to take out the previous low and sweep the stops of local "long players". The price quickly reaches the previous low and hunts the stops. This is seen with the high wick above the short candle.
By now, the logic for points 5 and 6 should be clear. The price is simply seeking to sweep liquidity from both sides without a strong directional intent. Specifically:
5. A liquidity sweep occurs here with a long-wick candle (stop run) to the upside, followed by a reversal downward.
6. Here, the price made a lower low (below Point 4), but more importantly, it performed a false breakout of the diagonal support line and returned under the accompaniment of strong bullish candles. This movement deserves a "+" as the point that formed local support. An upward move follows.
# - - - - -
Conclusion:
I. Every time you open a trade and set a target, ask yourself: If the price is to reach point X, through which levels must it pass?
II. We can't always understand why the price stopped at a certain point, but if we catch the moment, we can assume where it will go locally. Once it arrives—make a new assumption.
III. For example, the current target for Copper is to sweep the local high at 5.6171. What happens next is unknown. What happens before that? A correction to 5.4924 would be locally counterproductive; it's more logical to sweep the high first and then assess market sentiment.
IV. However, logic doesn't always work, as the price has already failed to break the local "wall" at 5.58 three times. It’s a matter of time, but it might pull back lower to gain momentum.
V. Once the target is hit, the picture resets, and we wait to see where the "Snake" wants to crawl next. Will it hold above? Will it drop immediately? There is a particular probability that after a new high, we will see a liquidity sweep down to 5.49 or even 5.41.
VI. But looking at the patterns and higher liquidity zones, the target at 5.685 looks very tempting.
# - - - - -
So, what's the move? Long? Short? Observation? My scenario is on the chart. Share yours for comparison.
# - - - - -
P.S. Trading isn't about predicting the future. It’s about countering the assumption of exactly where the algorithm or big capital is going to deceive us.
# - - - - -
DISCLAIMER: Not financial advice. Everyone must make trading decisions at their own risk, guided only by their own criteria and strategy for opening or not opening a trade.
Заметка
Price reached the main target faster than expected. Is there any shift in fundamentals?Сделка закрыта: достигнута тейк-профит цена

Visit my Risk Enforcement App → mywarner.app/
Follow me on Telegram → t.me/totsamiykaa
Watch me on YT → youtube.com/@totsamiykaa
See me on Threads → threads.com/@totsamiykaa
Follow me on Telegram → t.me/totsamiykaa
Watch me on YT → youtube.com/@totsamiykaa
See me on Threads → threads.com/@totsamiykaa
Похожие публикации
Отказ от ответственности
Информация и публикации не предназначены для предоставления и не являются финансовыми, инвестиционными, торговыми или другими видами советов или рекомендаций, предоставленных или одобренных TradingView. Подробнее читайте в Условиях использования.
Visit my Risk Enforcement App → mywarner.app/
Follow me on Telegram → t.me/totsamiykaa
Watch me on YT → youtube.com/@totsamiykaa
See me on Threads → threads.com/@totsamiykaa
Follow me on Telegram → t.me/totsamiykaa
Watch me on YT → youtube.com/@totsamiykaa
See me on Threads → threads.com/@totsamiykaa
Похожие публикации
Отказ от ответственности
Информация и публикации не предназначены для предоставления и не являются финансовыми, инвестиционными, торговыми или другими видами советов или рекомендаций, предоставленных или одобренных TradingView. Подробнее читайте в Условиях использования.